
Figures & data
Figure 1 Flow diagram of eligible cases.
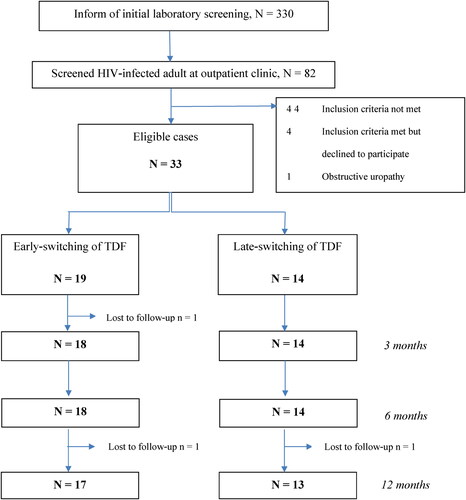
Table 1 Baseline characteristics and pre-switch laboratory markers in the two groups
Figure 2 Kaplan–Meier survival curves comparing probability of no complete recovery between the two groups.
Survival analysis performed using Kaplan–Meier survival curves and log-rank test.
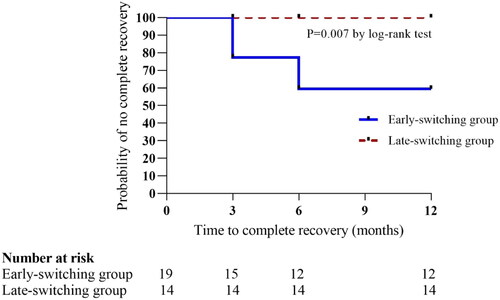
Figure 3 Changes in tubular function markers from pre-switch levels to 3, 6, and 12 months after switching [mean ± SD (95% CI)]. (A) Estimated glomerular filtration rate (eGFR); (B) tubular maximum reabsorption of phosphate/glomerular filtration rate (TmP/GFR); (C) fractional excretion of urinary phosphate (FEUP); (D) fractional excretion of uric acid (FEUA); and (E) urinary protein-creatinine index (UPCI).
Repeated-measures ANOVA was used to calculate change for each urinary marker during the follow-up within each group. Pairwise comparisons at each time point were made using repeated-measures ANOVA with Bonferroni’s correction for multiple comparisons.
Striped light-gray box = early-switching group.
Dark-gray box = late-switching group.
Dashed line = cutoff of normal value.
*Significant.
![Figure 3 Changes in tubular function markers from pre-switch levels to 3, 6, and 12 months after switching [mean ± SD (95% CI)]. (A) Estimated glomerular filtration rate (eGFR); (B) tubular maximum reabsorption of phosphate/glomerular filtration rate (TmP/GFR); (C) fractional excretion of urinary phosphate (FEUP); (D) fractional excretion of uric acid (FEUA); and (E) urinary protein-creatinine index (UPCI).Repeated-measures ANOVA was used to calculate change for each urinary marker during the follow-up within each group. Pairwise comparisons at each time point were made using repeated-measures ANOVA with Bonferroni’s correction for multiple comparisons.Striped light-gray box = early-switching group.Dark-gray box = late-switching group.Dashed line = cutoff of normal value.*Significant.](/cms/asset/55b277c5-803f-4c0e-b6e4-97feb2820340/yhct_a_2113967_f0003_b.jpg)
Table 2 Changes in tubular markers, CD4, and lipid profile from the pre-switch value to 6 and 12 months after switching