
Figures & data
Table 1. Characteristics of the sampled participants (N = 4,399).
Table 2. Comparison of HIV status by predictor variables (N = 4,399).
Table 3. Coefficients and risk scoring for the independent predictors of HIV using the training dataset.
Table 4. Performance characteristics of the selected risk scores based on the training dataset.
Figure 1. Training and testing AUC of the prediction model.
X-axis is the model’s sensitivity while y-axis is 1–Specificity. The blue line represents the testing ROC while red line represents the training ROC.
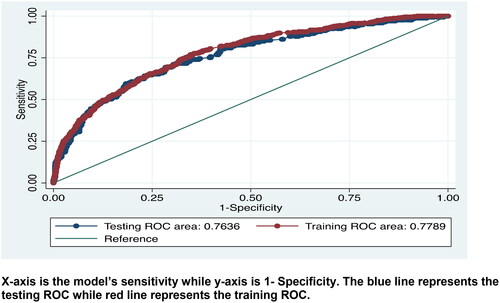
Table 5. Prediction model’s classification table based on the training dataset.
Table 6. Performance of the risk prediction model on the training and testing datasets.
Availability of data and materials
The datasets analyzed during the current study are not publicly available due
Data protection policy of South African Medical Research Council (SAMRC) which only makes the data available on request. Data can be requested from SAMRC through Dr Darshini Govindasamy on [email protected]