
Figures & data
Table 1. Baseline Characteristics stratified by weight trajectory prior to switch.
Figure 1. Percent change in weight following ART switch at 3, 6, 9, and 12 months. Colored lines represent the change in weight over the one year prior to ART switch. Mean and standard deviations are illustrated by box plots included for each time period.
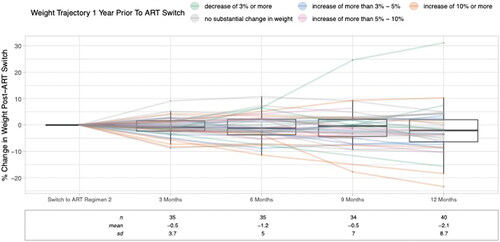
Figure 2. Differences in weight change estimates by different subgroups are shown in Forest plots. Significant (p < .05) changes from pre to post switch are indicated by the black box, and p values ≥.05 or greater are indicated by the white box on the Forest plot. Statistical significance for comparisons across categories are indicated in the right column. BMI (body mass index), NH (non-Hispanic), TAF (tenofovir alafenamide fumarate), TDF (tenofovir disoproxil fumarate).
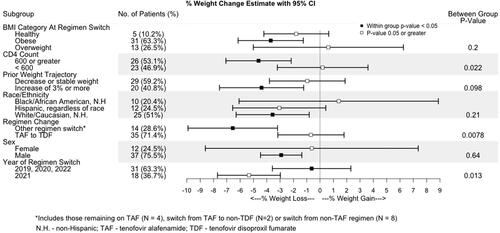
Figure 3. Pre-ART switch weight trajectories categorized by year of ART switch. Percentage of patients categorized into percent weight change categories or no substantial change in weight based on ART switch in years 2019, 2020, 2021 or 2022.
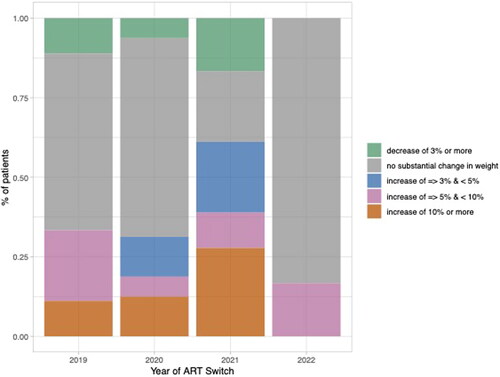
Figure A1. Percent weight change from ART switch. Trends show percent weight change from 12 months prior to ART switch to 12 months post ART switch. Individual graphs show subgroups and trends in percent weight change between subgroups. ART: Antiretroviral therapy; BMI: Body Mass Index; N.H.: non-Hispanic; TAF: Tenofovir Alafenamide Fumarate; TDF: Tenofovir Disoproxil Fumarate; HIV: Human Immunodeficiency Virus; T2DM: Type 2 Diabetes Mellitus; HTN: Hypertension.
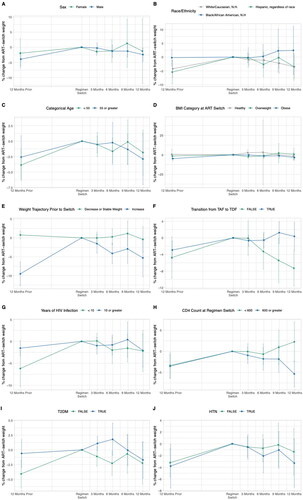
Table A1. PWH characteristics by more nuanced weight trajectory prior to ART switch.
Table A2. Pre-ART weight change characteristic testing.
Table A3. Results of sensitivity analyses.
Table A4. PWH characteristics stratified by 2021 year of switch.
Table A5. Subgroup model results.
Table A6. PWH characteristics by TDF to TAF or non-TDF to TAF Switch.