Figures & data
Figure 1. Comparison between experimental result from Taleb et al. and the calculated results based on Desalos’s, Abrassart’s, Leblond’s and ex-modified functions.
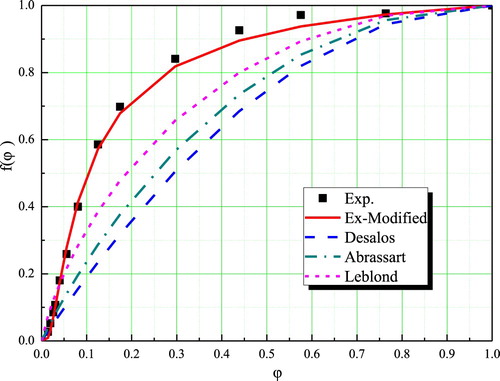
Table 1. Various expressions of  functions.
Figure 2. Measured and calculated residual stress distributions based on various TP equations of 60 mm-diameter 40CrNiMo after water quenching: (a) tangential stress and (b) axial stress.
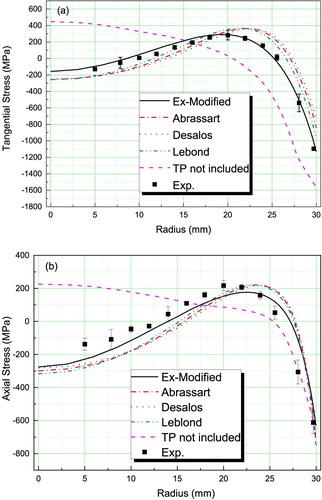
Figure 3. FES mesh of drive shaft.
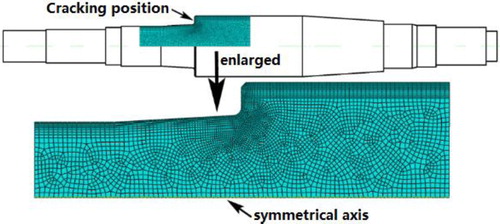
Figure 4. Finite element simulation of radial quenching stress of the driving shaft in different quenching ways: DQ (a), ATQ1 (b), and ATQ2 (c).
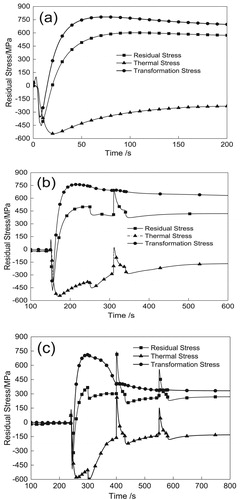
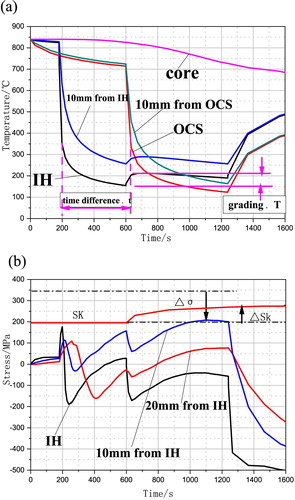
Figure 5. Variation of temperature (a) and stress (b) with time calculated by FES for failure process inner hole (IH), outer circle surface (OCS).
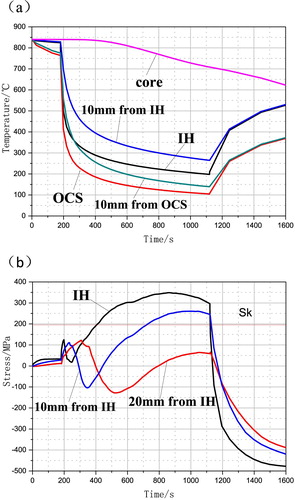
Figure 6. Variation of temperature (a) and stress (b) with time calculated by FES for DTGQ process inner hole (IH), outer circle surface (OCS).