Figures & data
Figure 1. Schematic diagram of the fluidization bed reactor.
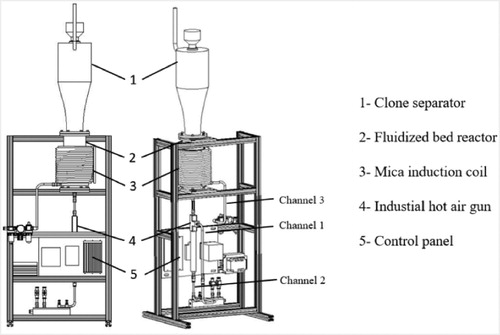
Table 1. Chemical composition of the TiH2 powder used in the study.
Figure 2. Powder dislocation in fluidized bed reactor.
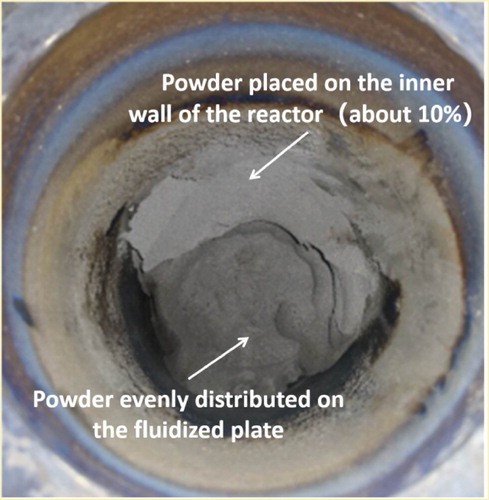
Figure 3. XRD patterns of as-received TiH2 powder and the dehydrogenated powders from the surface center and inner wall of the reactor, respectively.
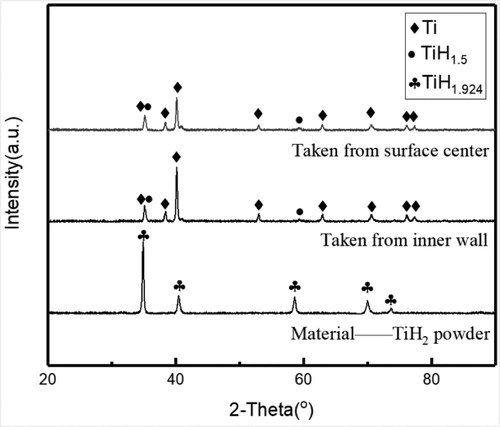
Figure 4. SEM images of powder particles from. (a) as-received TiH2 powder, (b) dehydrogenated Ti powder from the surface center, and (c) dehydrogenated Ti powder from the inner wall of the reactor.
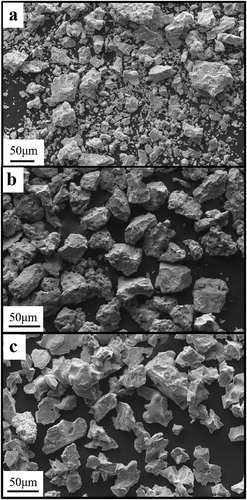
Figure 5. Internal schematic diagram of fluidized bed reactor.
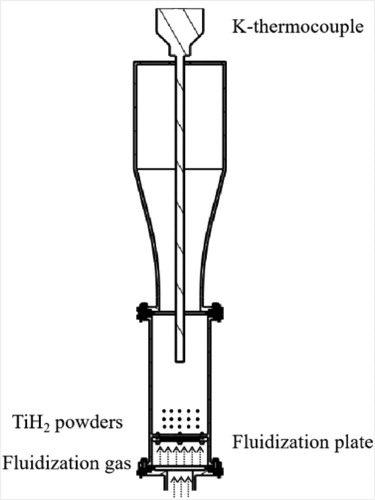
Figure 6. Particle size distribution of (a) as-received TiH2 powder, (b) dehydrogenated Ti powder from the surface center, and (c) dehydrogenated Ti powder from the inner wall of the reactor.
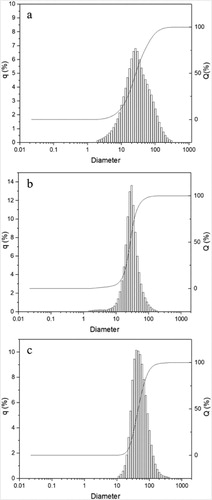
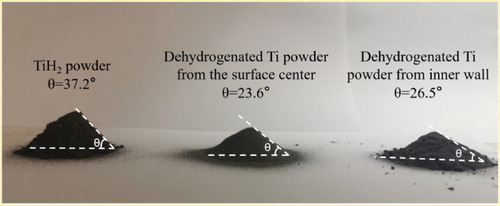
Figure 7. Images showing the measurments of the angles of repose of the as-received TiH2 powder, powder from the surface center of the fluidization plate and powder from the inner wall of the reactor.