Figures & data
Figure 1. Microscopy images of a YBCO film grown onto LaAlO3 substrate at different magnifications. (a) SEM micrographs took from the top view and tilted views ((b) and (c)).
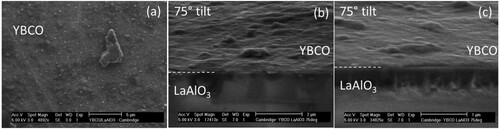
Figure 2. EDX analysis for the YBCO/LaAlO3 film. (a) Electron microscope micrograph, (b) EDS mapping and (c) EDS quantification. The spectrum shows the higher presence of La, Al, and O elements peaks corresponding to the substrate.
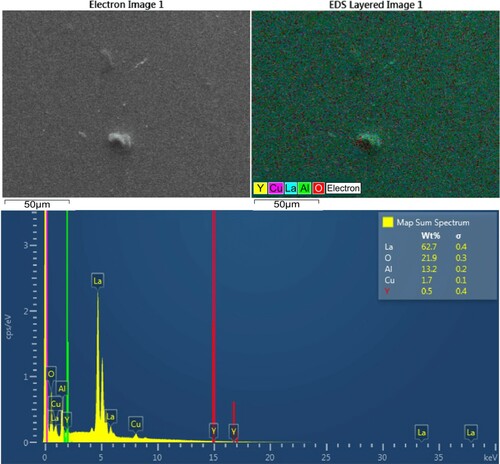
Figure 3. XRD pattern of the YBCO film grown on LaAlO3 substrate. Top: The normal intensity axis is in arbitrary units, and Bottom: XRD in semi-logarithmical scale. The presence of the (00l) reflections corresponding to YBCO indicates that the crystallite grew in the c-direction. Small reflections corresponding to the phases CuO, Y2O3 (unreacted), and Y2BaCuO5 (secondary) were also detected in addition to the YBCO phase.
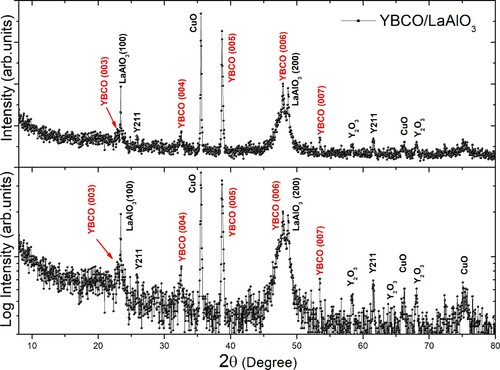
Figure 4. (a) Draw of Eulerian cradle to tilt the sample taken into consideration during measuring the crystallographic texture. (b) Rocking curve corresponding to the (005) reflection. And ϕ-scan spectra of one colony of crystallites oriented along the c-axis (c), and two colonies of crystallites oriented along the a-axis (d).
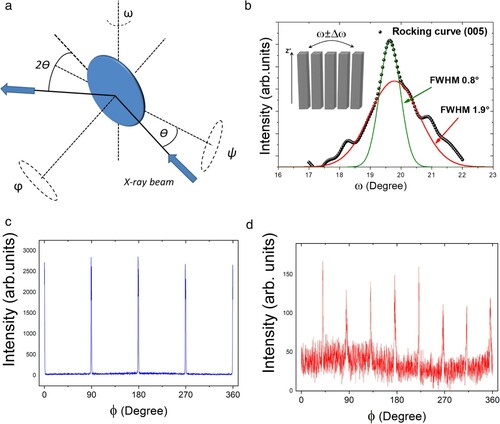
Figure 5. Magnetic moment vs. temperature measurement of the YBCO film grown by the CSD technique. Inset: First derivate ZFC and FC curves.
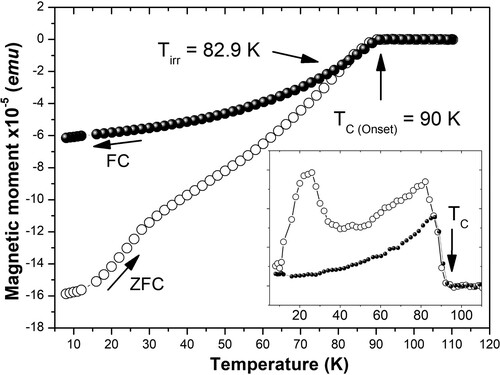
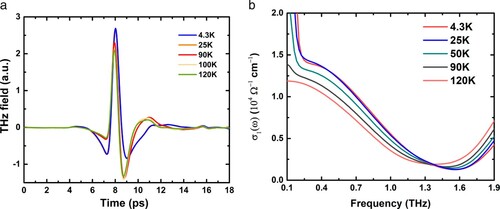
Figure 6. Terahertz measurements of YBCO granular film deposited onto LaAlO3 substrates by the CSD method. (a) Time-domain picosecond (ps) pulse response transmitted through YBCO film for different sample temperatures. All the measurements were performed in a nitrogen purged environment to eradicate any features from water absorption. (b) THz conductance spectra obtained from normalized transmittance amplitude spectra concerning reference substrate.