
Figures & data
Figure 1. The initial condition of the model with the martensitic embryo in the two-dimensional square domain.
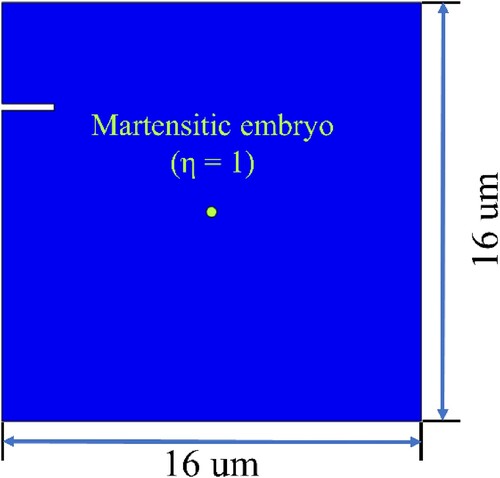
Figure 2. Evolution of the martensite microstructure with its associated stress field with the quenching time at the quenching temperature : (a–d) martensite; (e–f) equivalents stress; (a, e) 1 s; (b, f) 2 s; (c, g) 5 s; (d, h) 10 s.
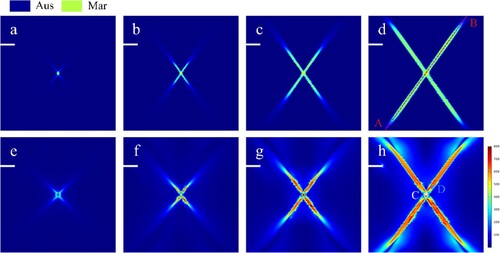
Figure 3. Evolution of the equivalent stress with the quenching time (a) along the lines A–B (A (−5.6, −8) and B (5.6, 8)) and (b) the asterisks C (0, 0) and D (0.7, 1) marked in (d) and (h), respectively.
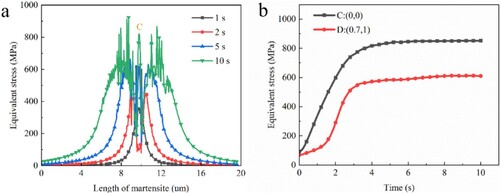
Figure 4. Evolution of the martensite microstructure with its associated stress field with the quenching time at the quenching temperature : (a–d) martensite; (e–f) equivalents stress; (a, e) 1 s; (b, f) 2 s; (c, g) 5 s; (d, h) 10 s.
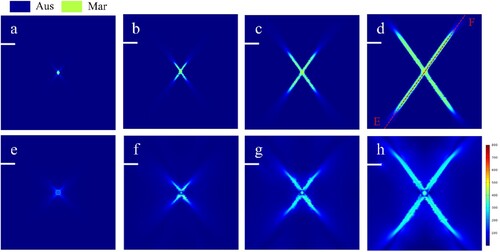
Figure 5. The equivalent stress distribution along the lines A–B and lines E–F marked in (d) and (d), respectively, after the martensite formed in the domain.
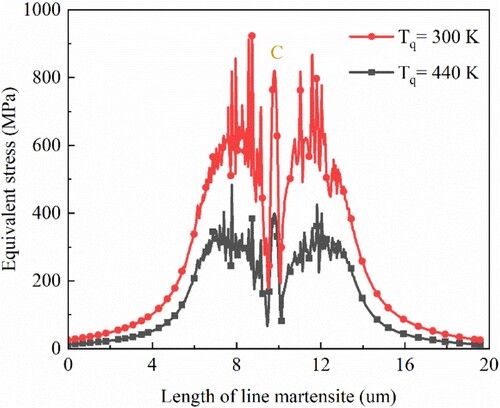
Figure 6. The equivalent stress distribution along the lines A–B marked in (d) after the quenching process and then tempering at different temperatures.
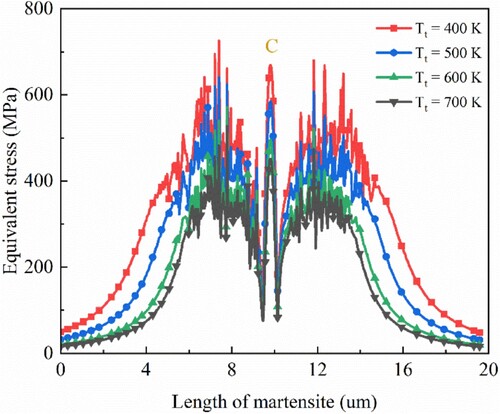
Figure 7. Length, radius and sampling position of the cylinder.
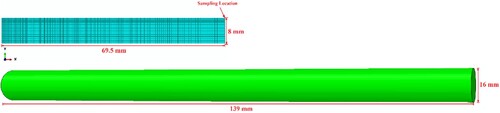
Figure 8. The (a) cooling curve and (b) equivalent stress distribution diagrams of the ATQ process.
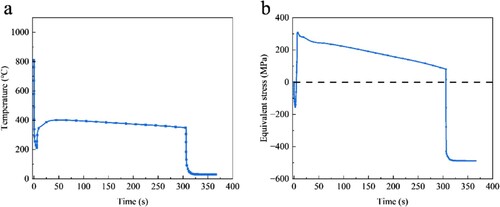
Figure 9. The cooling curve of the crankshaft surface.
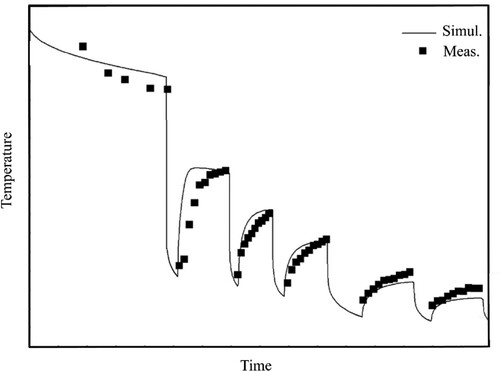
Table 1. The mechanical properties of crankshaft after quenching and tempering.