Figures & data
Table 1. Chemical compositions of the designed Fe-Cr-Al alloys (wt.%, weight percent).
Figure 1. The OM of the S1-0.1Zr alloy (a) and S2-0.3Zr alloy (b), and the SEM secondary electron morphology of S2-0.3Zr after solid solution.
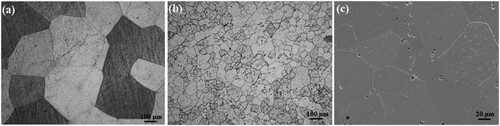
Figure 2. SEM images of the designed alloys at 1073 K aging for different time, (a, c, e): S1-0.1Zr alloy, (b, d, f): S2-0.3Zr alloy.
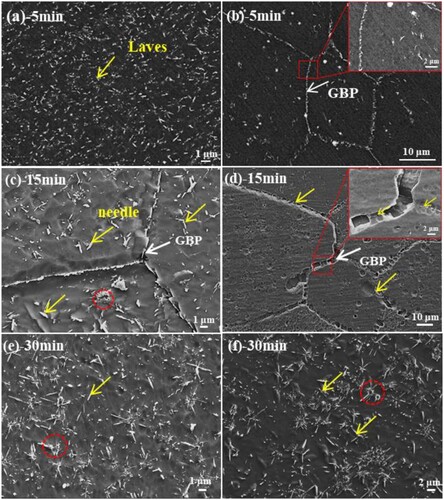
Figure 3. SEM images of the designed alloys at 1073 K aging for 12 and 24 h. (a, c, e): S1-0.1Zr, (b, d, f): S2-0.3Zr.
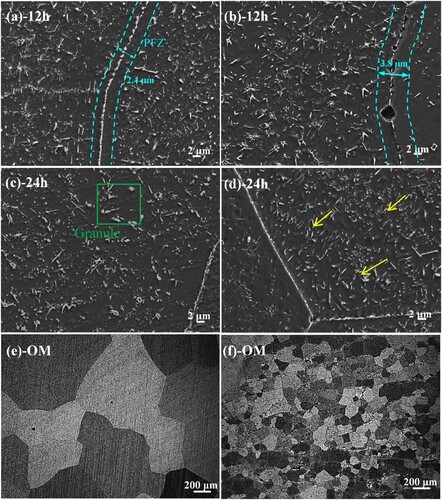
Figure 4. The average volume fraction (a) and the particle size (b) of the precipitates in the designed alloys during long-term aging at 1073 K.
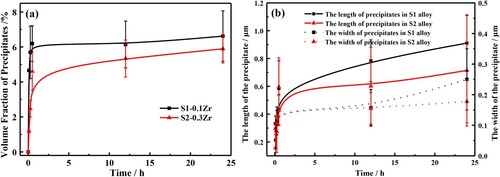
Figure 5. The XRD patterns of the designed alloys after aging for 24 h.
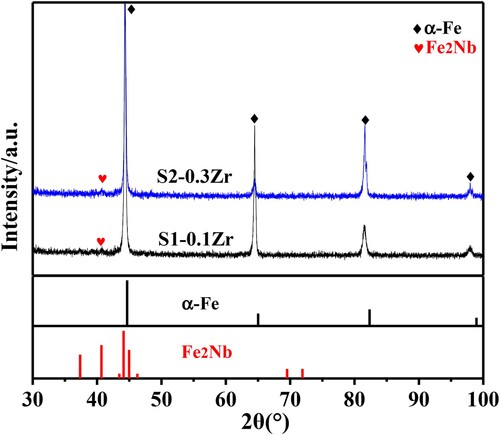
Figure 6. TEM bright-field (BF) images and SAED patterns of the precipitated particles in the designed alloys at 1073 K, (a): S1-0.1Zr-5 min, (b): S2-0.3Zr-5 min, (c): S1-0.1Zr-24 h, (d): S2-0.3Zr-24 h; and the high resolution TEM image of the nano-precipitates in the S2-0.3Zr-5 min (e), and Laves in S1-0.1Zr-24 h (f).
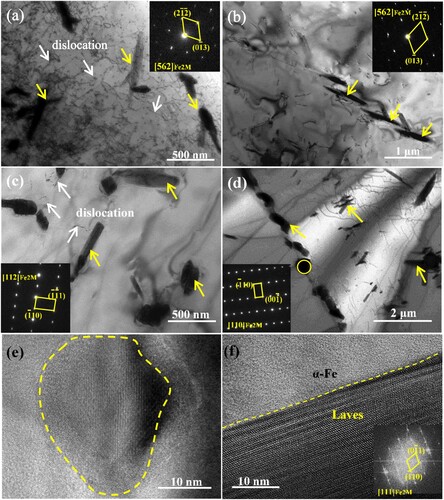
Figure 7. HAADF image and the corresponding elemental maps of the 1073 K-aged S1-0.1Zr alloy by the Super-X EDS.
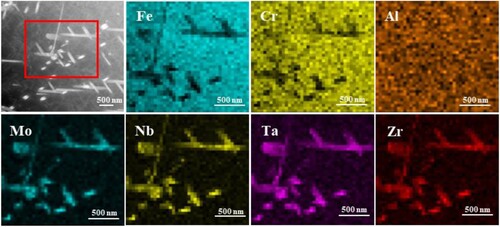
Figure 8. (a): Engineering stress–strain curves of the designed Fe-Cr-Al-M (M = Mo,Nb,Ta,Zr) alloys at 1073 K aging for 24 h, and (b): microhardness variation of the designed alloys at different states. The fracture surface morphologies of the alloys after aging for 24 h, (c): S1-0.1Zr, (d): S2-0.3Zr.
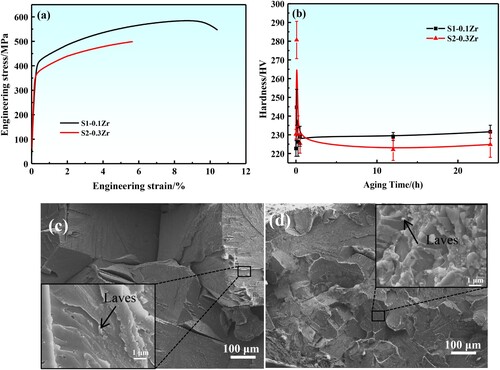
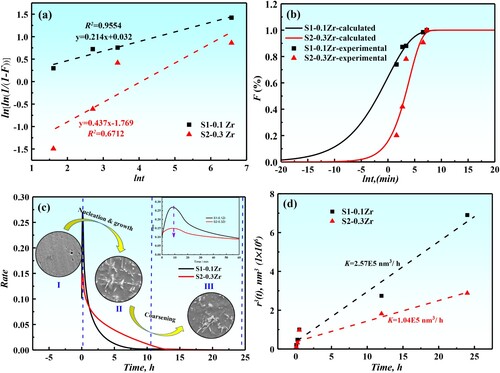
Figure 9. (a): lnln(1/(1-F))-lnt curves of precipitates in different alloys at 1073 K; (b): phase transformation kinetics curves of different alloys at 1073 K; (c): the precipitate rate changes with aging time and the microstructure evolution of different alloys; (d): variation of the mean particle radius r3 with the aging time at 1073 K for the designed alloys.