Figures & data
Figure 1. Images of experimental materials at different steps: (a) small pieces cut from the four scrap AA6063 profiles, (b) blend of the small pieces from different scrap profiles, (c) a small piece compact, (d) a forging compact, (e) 9:1 rod, (f) 25:1 rod.
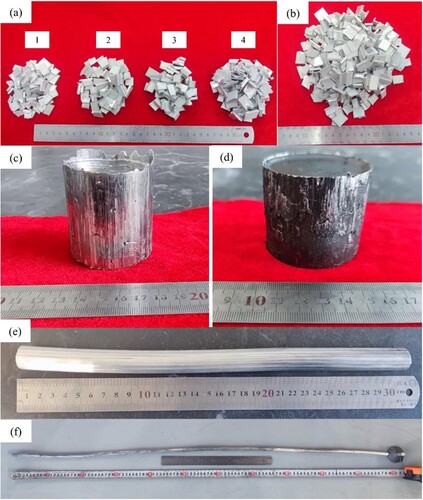
Table 1. Compositions of four scrap AA6063 aluminum alloy profiles (wt.%).
Table 2. Composition of the 9:1 rod (wt.%).
Table 3. Relative densities of the small piece compact, forging compact and as-extruded rod.
Figure 2. SEM images of the microstructure of small pieces from the four scrap profiles: (a) 1, (b) 2, (c) 3, (d) 4.
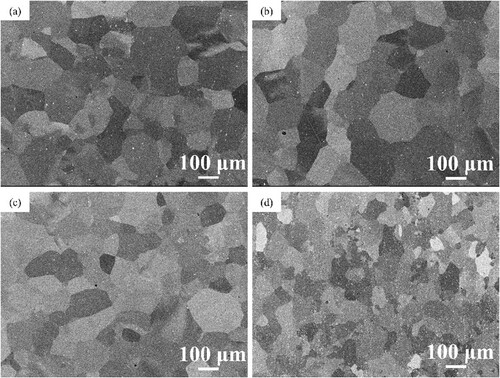
Figure 3. Optical microscopy images of the microstructure of small pieces from the four scrap profiles: (a) 1, (b) 2, (c) 3, (d) 4.
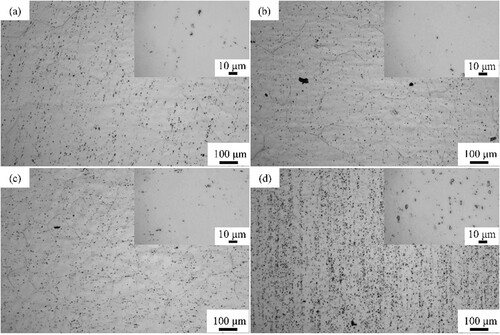
Figure 4. SEM images and EDS spectra of the second phase particles in the microstructure of small pieces form the four scrap profiles: (a) and (b) 1, (c) and (d) 2, (e) and (f) 3, and (g) and (h) 4.
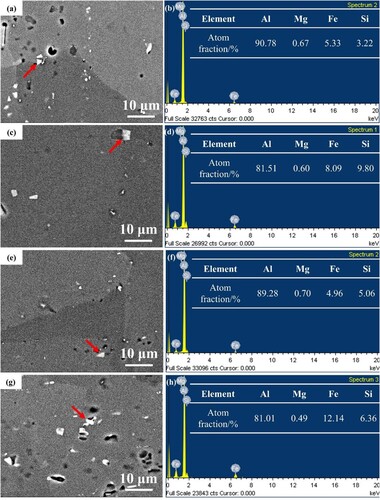
Figure 5. XRD patterns of the as-extruded and heat-treated samples.
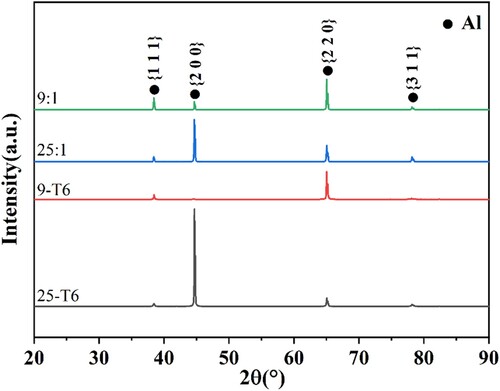
Figure 6. Optical microscopy images of the microstructure of the four samples: (a) 9:1, (b) 25:1, (c) 9-T6, (d) 25-T6.
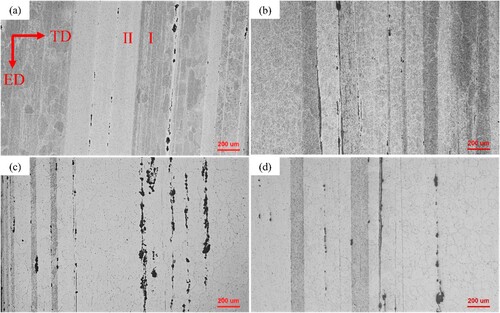
Figure 7. SEM image and EDS elemental maps of the microstructure of two samples: (a) 9:1, (b) 25:1.
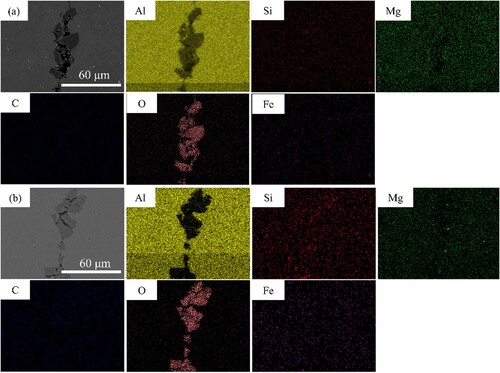
Figure 8. SEM images of the microstructure of I and II regions in the as-extruded samples: (a) 9:1, (b) 25:1.
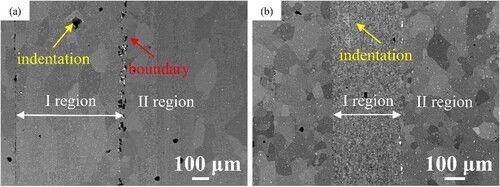
Table 4. Compositions of different types of regions in the 9:1 sample (wt.%), determined by EDS area analysis.
Table 5. Compositions of different types of regions in the 25:1 sample (wt.%), determined by EDS area analysis.
Figure 9. EBSD band contrast and IPF contrast images of the microstructure of as-extruded samples: (a) and (b) 9:1, (c) and (d) 25:1.
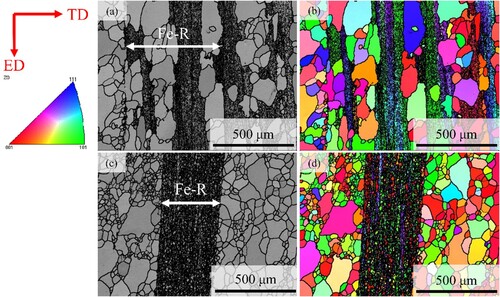
Figure 10. EBSD band contrast and IPF contrast images of T6 heat-treated samples: (a) and (b) 9-T6, (c) and (d) 25-T6.
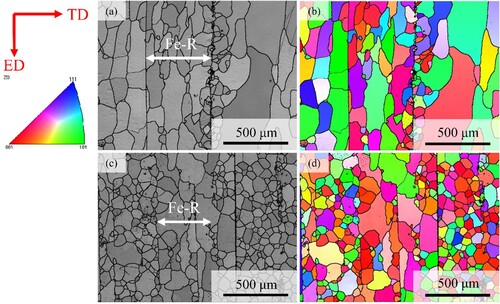
Figure 11. The distributions of aspect ratios of the Al grains of T6 heat-treated samples: (a) 9-T6, (b) 25-T6.
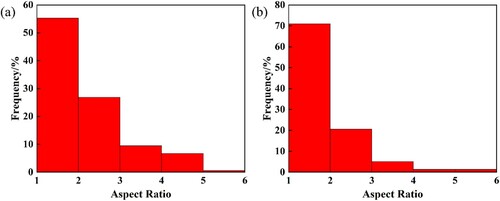
Figure 12. Recrystallization distribution of grains in the four samples: (a) 9:1, (b) 25:1, (c) 9-T6, (d) 25-T6, (e) histograms showing the fractions of different types of grains in the samples.
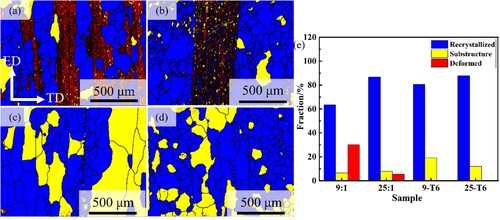
Figure 13. SEM images of the microstructure of different types of regions of T6 heat-treated samples: (a) 9-T6, (b) 25-T6.
Table 6. Compositions of different types of regions in the 9-T6 sample (wt.%), determined by EDS area analysis.
Table 7. Compositions of different types of regions in the 25-T6 sample (wt.%), determined by EDS area analysis.
Figure 14. Microhardness values of the samples.
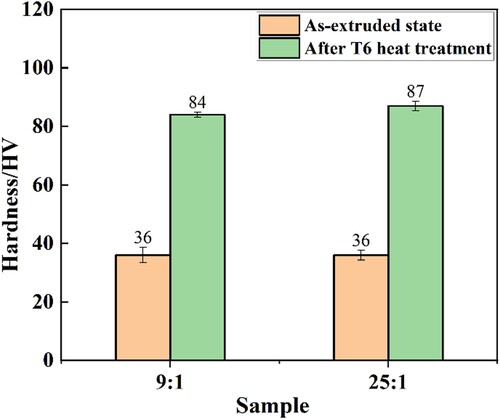
Figure 15. Engineering stress-engineering strain curves of the samples.
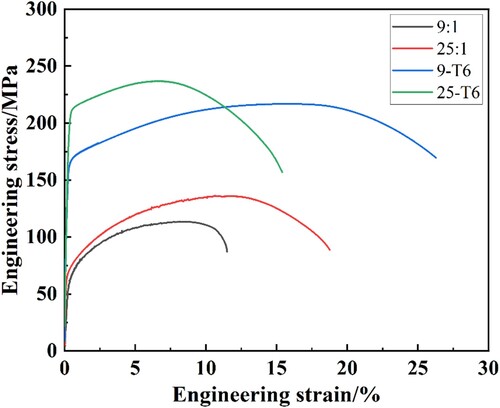
Table 8. Tensile properties of the samples.
Figure 16. SEM images of the fracture surfaces of the tensile test specimens cut from the samples: (a) and (b) 9:1, (c) and (d) 25:1, (e) and (f) 9-T6, (g) and (h) 25-T6.
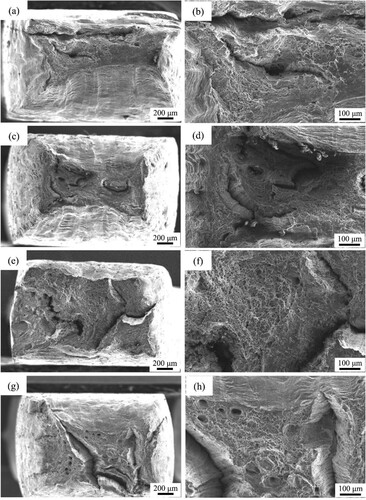
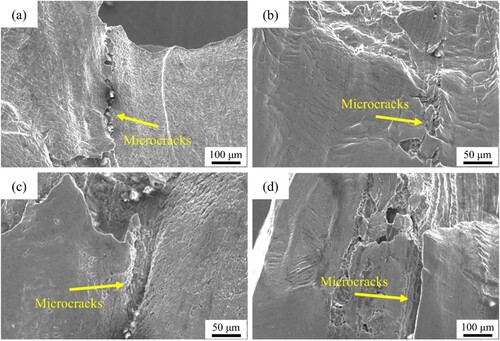
Figure 17. Longitudinal sections below the fracture surfaces of the tensile test specimens cut from the samples: (a) 9:1, (b) 25:1, (c) 9-T6, (d) 25-T6.