
Figures & data
Figure 1. Two-dimensional mesh division model of cylindrical sample.
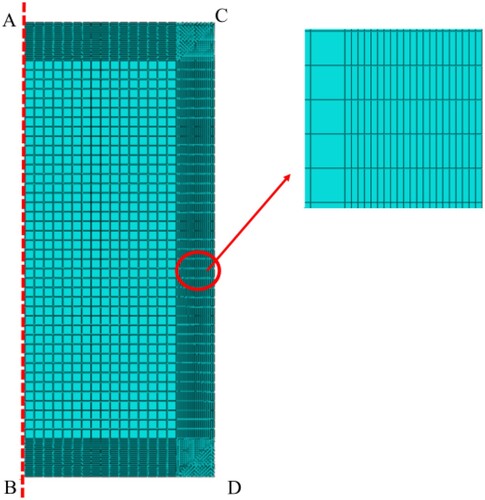
Figure 2. Carburizing furnace.
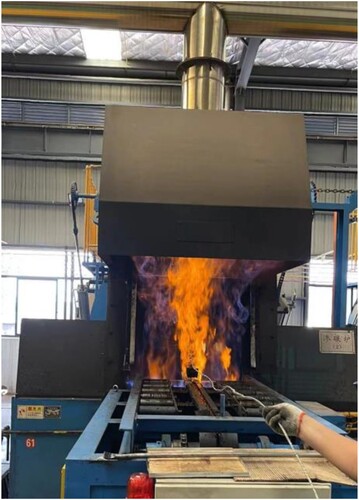
Table 1. Chemical composition (wt.%) of the base materials.
Figure 3. Carburizing and quenching process curve.
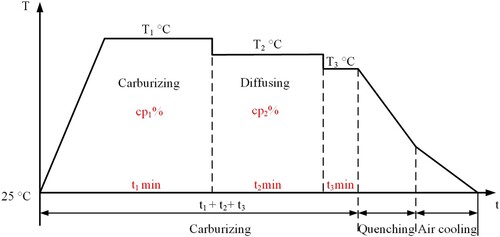
Figure 4. Pictures of furnace samples before carburizing by three different processes. (a) Process 1; (b) process 2 and (c) process 3.
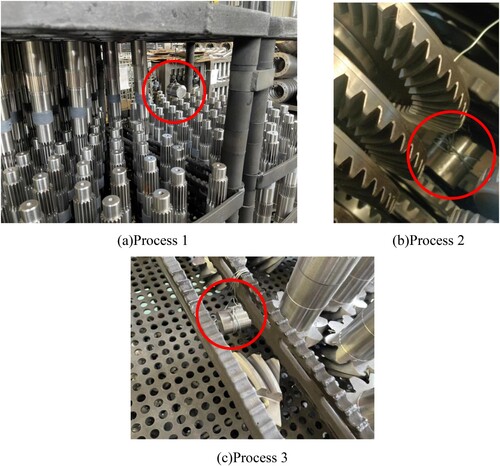
Table 2. Carburizing and quenching process.
Figure 5. Pictures of furnace samples after carburizing by three different processes. (a) Process 1; (b) process 2 and (c) process 3.
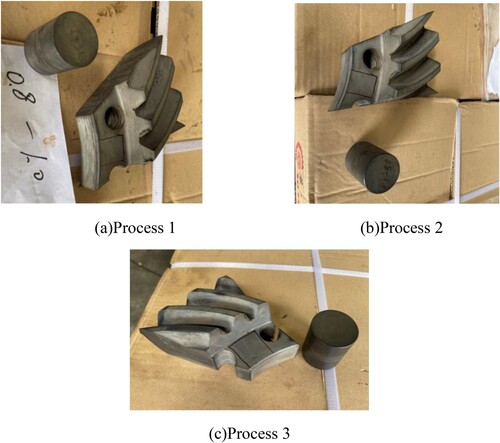
Figure 6. BRUEKR direct-reading spectrometer.
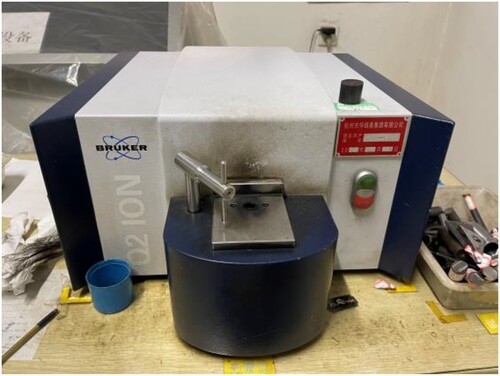
Figure 7. Three different process carbon concentration test positions. (a) Test positions and (b) the schematic diagram of the testing area.
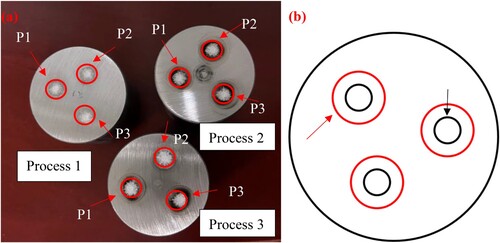
Figure 8. Comparison of experimental values and simulation values. (a) Simulation result point positions; (b) process 1; (c) process 2 and (d) process 3.
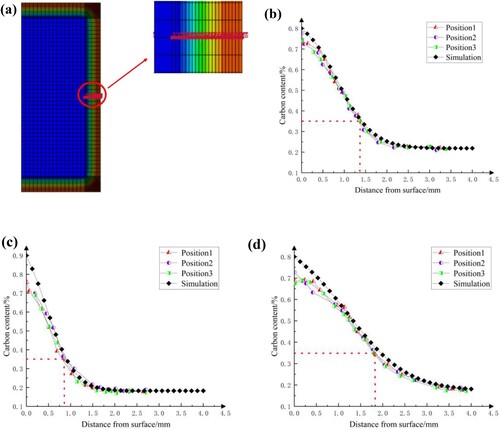
Figure 9. Microstructure after atmosphere carburizing. (a) Cylindrical sample; (b) sketch map; (c) surface; (d) sub-surface and (e) center.
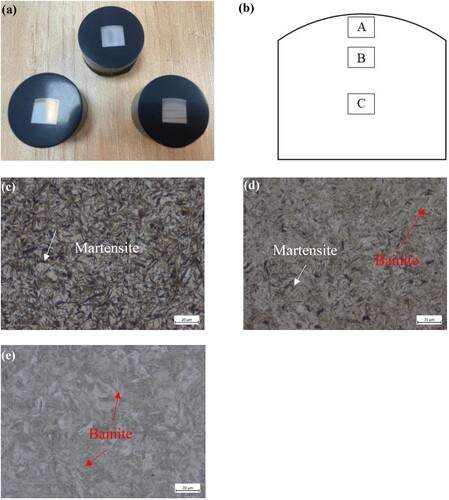
Figure 10. Microhardness profile of the carburized layer. (a) Indentation diagram and (b) three different process hardness gradients.
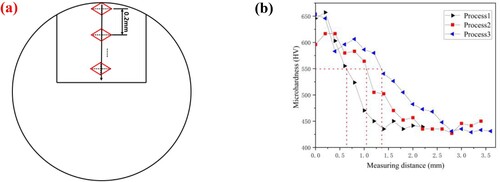
Table 3. Simulation generates a training set scheme list.
Figure 11. One-dimensional carburizing carbon concentration point location.
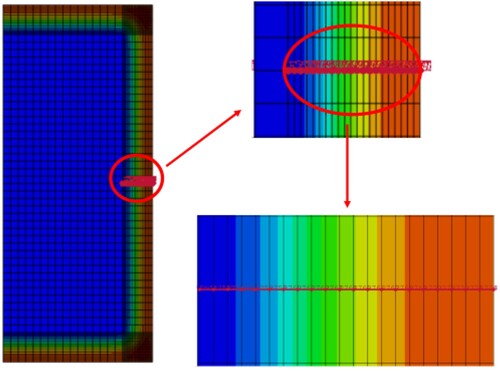
Figure 12. Schematic diagram of the BPNN structure.
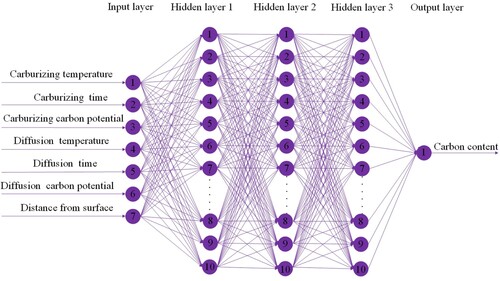
Figure 13. Learning curve chart of each training algorithm.
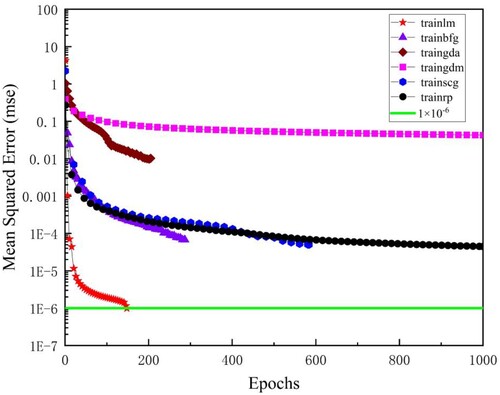
Figure 14. Comparison of predicted and simulated values for six different processes.
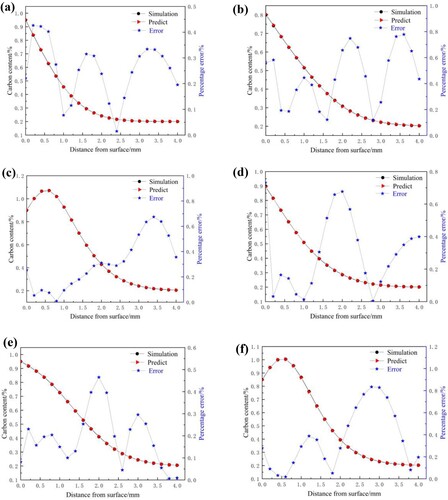
Table 4. Six sets of carburizing process parameters.
Figure 15. Square meshing.
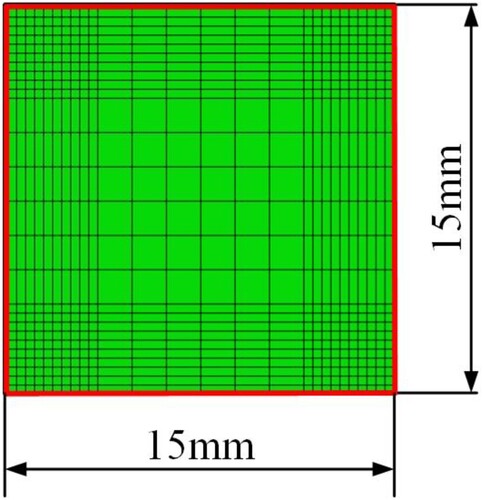
Table 5. Simulation generates a training set scheme list.
Figure 16. Training performance curve of the BPNN model.
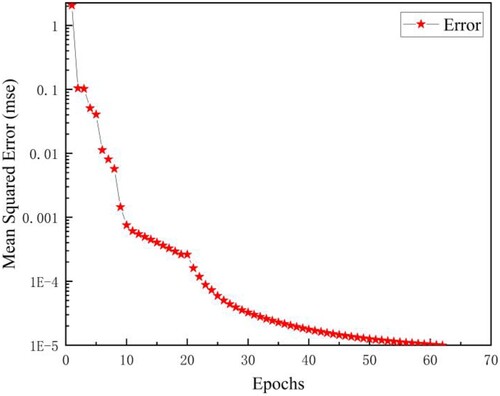
Figure 17. From left to right: (1) ground truths, (2) forecast results and (3) percent error.
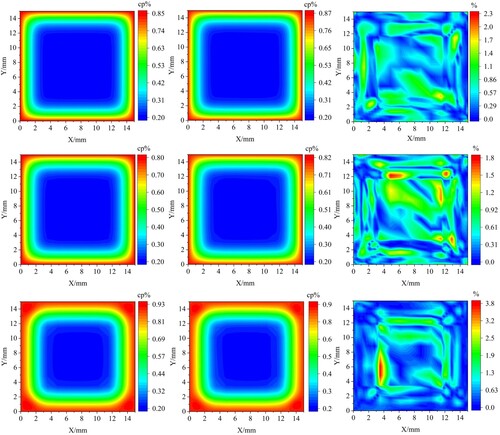
Table 6. Three sets of carburizing process parameters.
Table 7. Comparison of prediction time and simulation calculation time.