Figures & data
Table 1. Chemical compositions of U75V steel (wt.%).
Figure 1. Laser-induction hybrid strengthening temperature variation process chart: (a) schematic diagram of hybrid strengthening and (b) temperature field of hybrid strengthening.
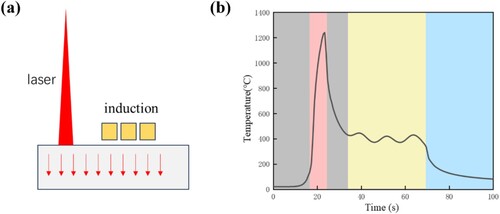
Figure 2. Evolution of temperature field in laser-induced hybrid strengthening process (a) 0.1 s, (b) 4 s, (c) 8 s, (d) 12 s, (e) 20 s, (f) 28 s, (g) 36 s, (h) 44 s, and (i) 52 s.
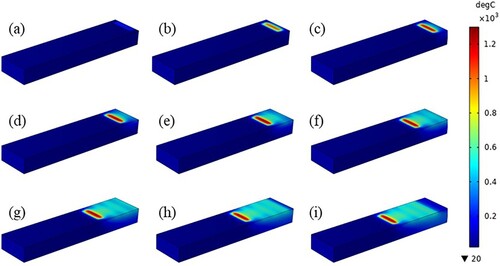
Figure 3. Temperature variation process of hybrid strengthening under different process parameters: (a) laser power, (b) heat source spacing, (c) inductive power and (d) scanning speed.
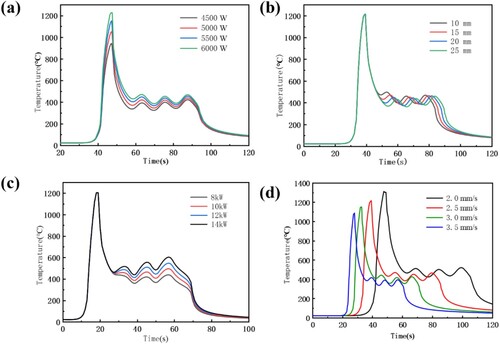
Figure 4. Temperature history of hybrid strengthening at different scanning speeds under temperature control mode.
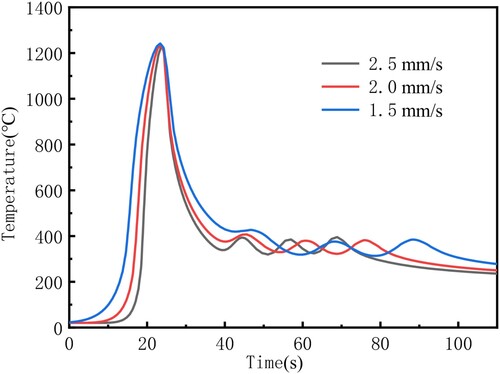
Figure 5. Temperature comparison between experimental and simulated results: (a) laser heat source and (b) induction heat source.
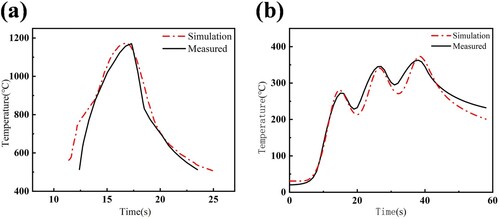
Figure 6. Temperature step response curve in the laser zone of (a) measured curve and (b) simulated data curve.
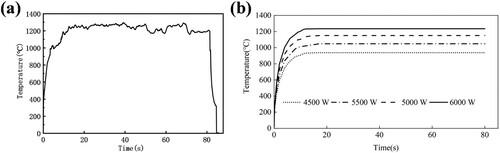
Figure 7. Structure diagram of temperature control system with feedforward decoupling compensation.
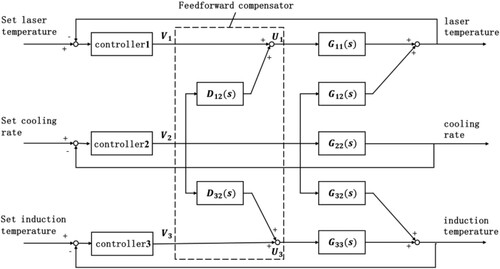
Figure 8. Structure diagram of fuzzy PI control principle.
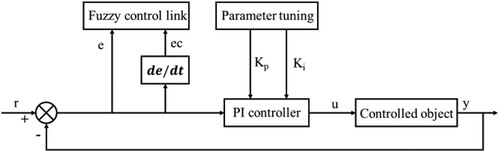
Table 2. Parameter table of laser temperature fuzzy control.
Table 3. Parameter table of induction temperature fuzzy control.
Table 4. Parameter table of cooling speed fuzzy control.
Table 5. Fuzzy control rule table.
Figure 9. Simulink simulation model of fuzzy PI decoupling controller.
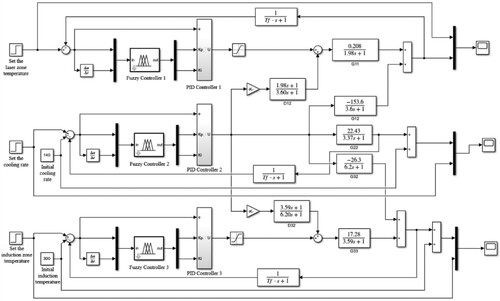
Figure 10. Comparison of fuzzy PI decoupling control and traditional PI control.
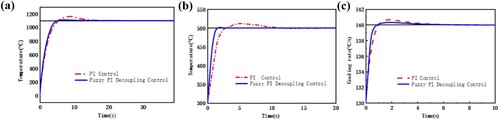
Figure 11. Schematic diagram of temperature control system for laser-induction hybrid strengthening.
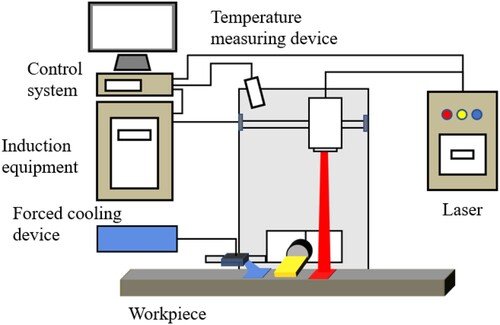
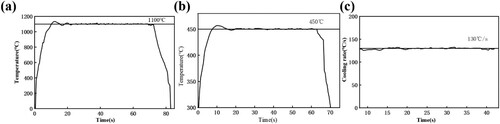
Figure 12. Temperature curve in constant power output mode for (a) temperature of laser-heated zone temperature, (b) temperature of induction heated zone and (c) cooling speed.
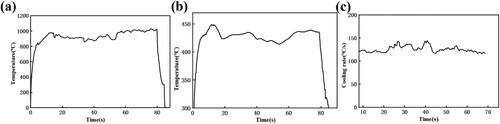
Figure 13. Temperature curve in temperature control mode for (a) temperature of laser-heated zone temperature, (b) temperature of induction heated zone and (c) cooling speed.