
Figures & data
Figure 1. EBSD orientation map of 12% Cr steel after compression deformation at 650°C. (a) 6%, (b) 8%, (c) 20%, (d) 50%.
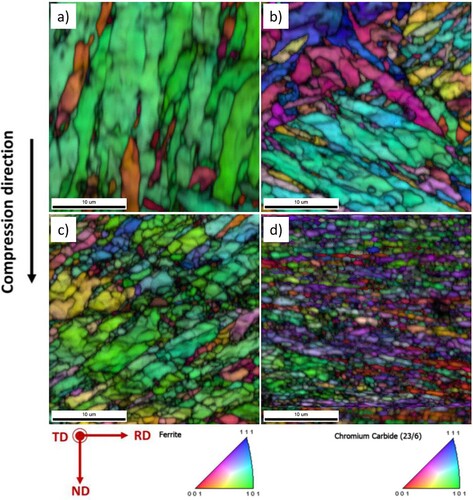
Figure 2. TEM images of 12% Cr steel after compression deformation at 650°C. (a) 6%, (b) EDS results corresponding to (a), (c) 20%, (d) 50%.
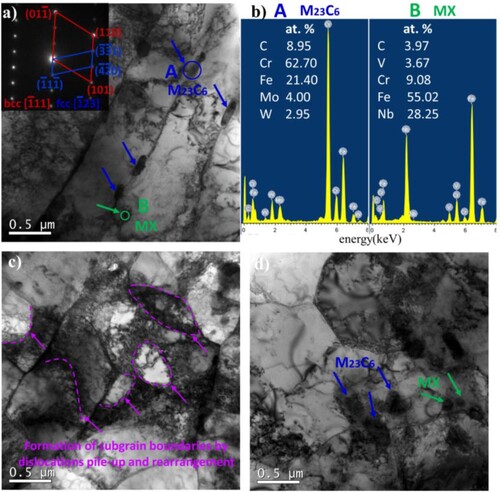
Figure 3. EBSD inverse pole figures (IPF) and grain boundary distribution images of 12% Cr steel after compression deformation at 650°C. (a) 3%, (b) 20%, (c) 50%.
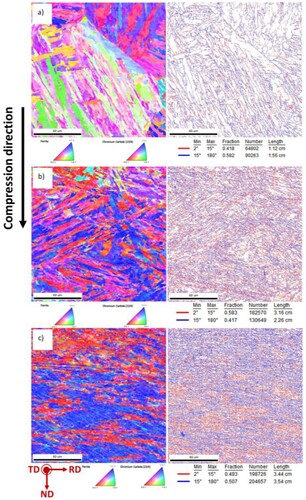
Figure 4. Evolutions of the proportion of low-angle grain boundaries with different amounts of compression deformation at 650°C.
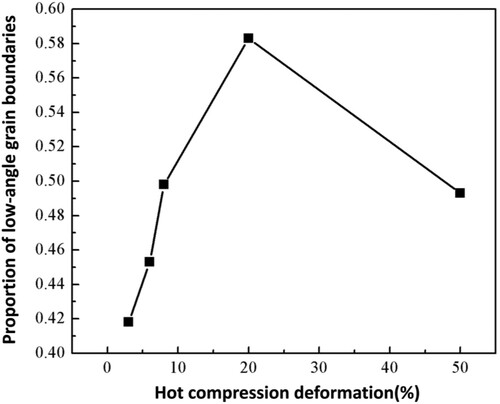
Figure 5. Evolutions of the distribution of grain boundary misorientation under different amounts of hot compression deformation at 650°C.
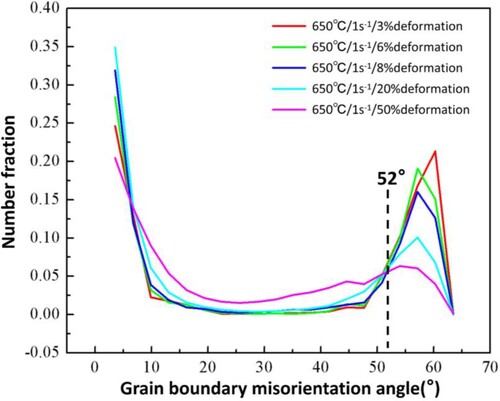
Figure 6. Texture images of inverse pole figures (IPF) of 12% Cr steel under different amounts of compression deformation. (a) 3%, (b) 6%, (c) 8%, (d) 20%, (e) 50%.
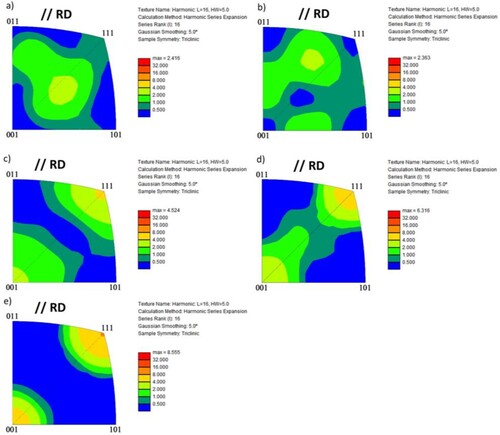
Figure 7. Changes of the intensity of <111> texture and <001> texture as a function of compression deformation amount at 650°C.
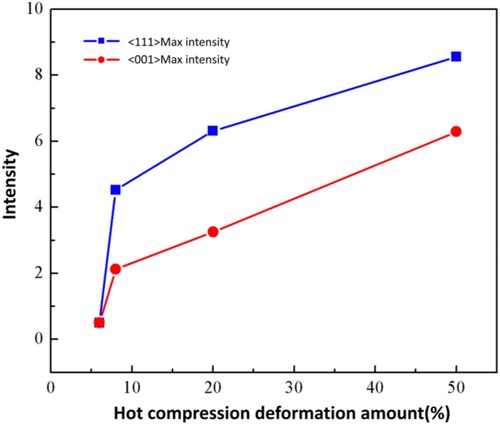
Figure 8. KAM images of 12% Cr steel under different amounts of compression deformation. (a) 3%, (b) 6%, (c) 8%, (d) 20%, (e) 50%.
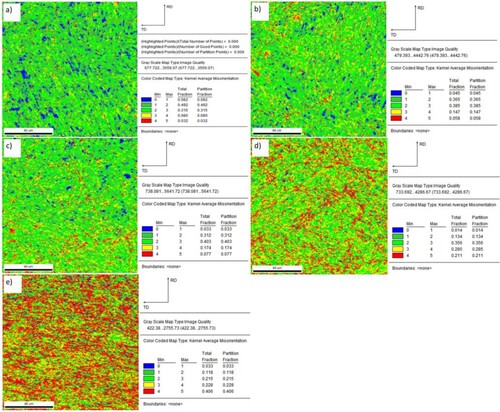
Figure 9. EBSD orientation map of 12% Cr steel at the compression deformation of 6%. (a) IPF, (b) Enlarged local image of region b in a, (c) Phase images with the deviation angle of the KS orientation relationship.
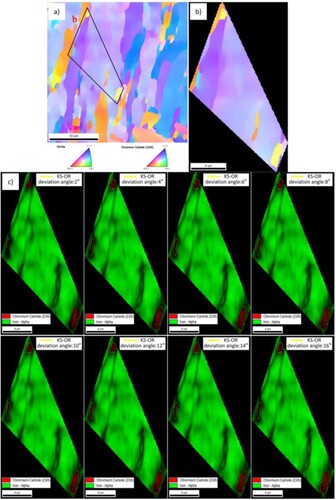
Figure 10. The deviation angle distribution map of the KS orientation relationship at the compression deformation of 6%.
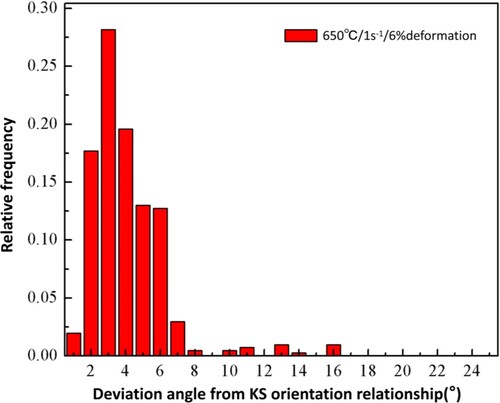
Figure 11. EBSD orientation map of 12% Cr steel at the compression deformation of 50%. (a) IPF, (b) Enlarged local image of region b in a, (c) Phase images with the deviation angle of the KS orientation relationship.
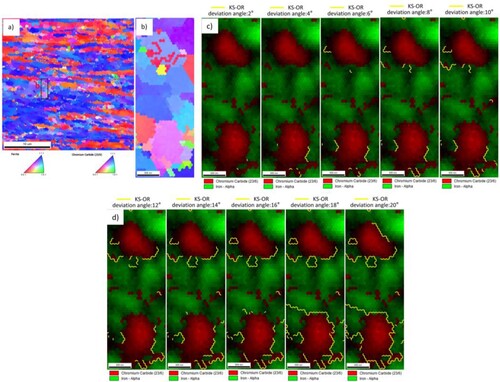
Figure 12. The deviation angle distribution map of the KS orientation relationship at the compression deformation of 50%.
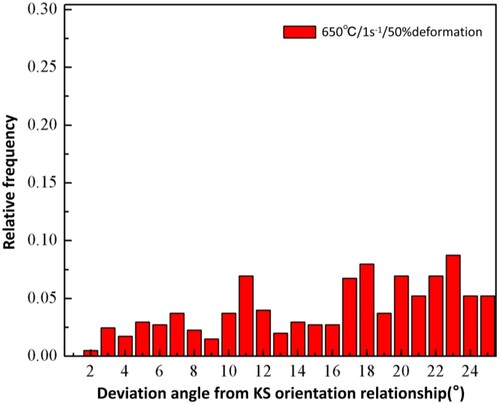
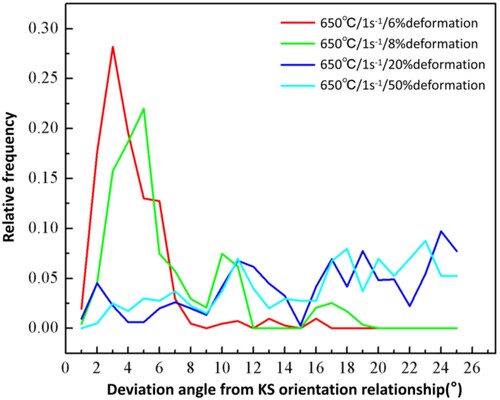
Figure 13. The deviation angle distribution map of the KS orientation relationship under different amounts of compression deformation.
Data availability statement
The data that support the findings of this study are available from the corresponding author upon request.