
Figures & data
Figure 1. Steps of combining crime rates by area with individual answers from the survey using Geographical Information Systems (GIS) as a basis for the regression model
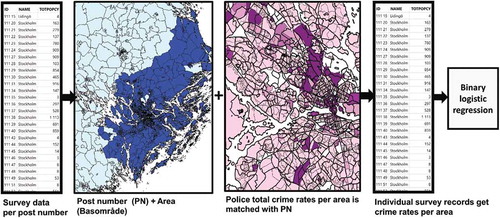
Figure 2. Young people’s safety perceptions on (a) metro/train and (b) bus, daytime and night-time, on the bus, at station/bus stop and on the way to/from them – night-time. Sample of university students in Stockholm, 2019
Table 1. The most common sexual violence experienced by women, by category along the trip (e.g., onboard, to/from, bus stop) and declared safety perceptions and by transportation mode
Table 2. Logistic regression results of Y = Young people’s declared unsafety, rail-bound and on the way to/from station
Table 3. Logistic regression results of Y = Young people’s declared unsafety when using buses or on the way to bus stops
Table A1. On the bus – Young people’s declared unsafety
Table A2. On the way to/from the bus – Young people’s declared unsafety
Table A3. On the rail-bound (metro, tram or commuter train)– Young people’s declared unsafety
Table A4. On the way to/from the station, or on the platform – Young people’s declared unsafety
