
Figures & data
Figure 1. Macrocystis pyrifera mitochondrial genome map.
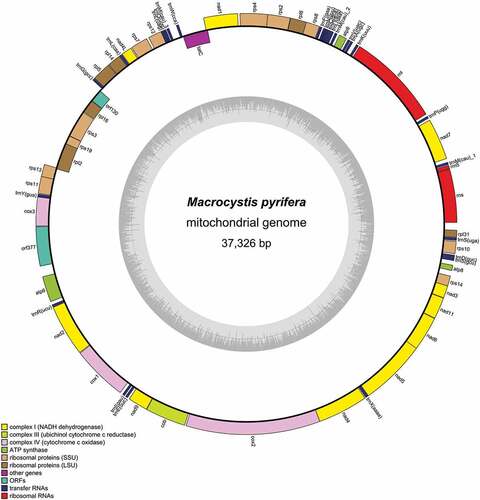
Figure 2. Macrocystis pyrifera chloroplast genome map.
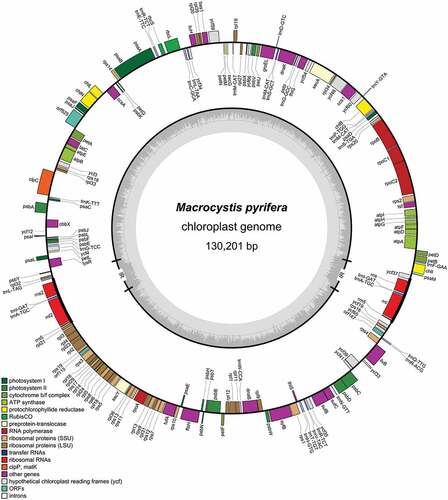
Figure 3. (a) Maximum likelihood phylogeny combining concatenated coding sequences from mitochondria and chloroplasts. Ultrafast bootstrapping is shown in the support values, only above 90%. (b) Haplotype network for cox1 from Macrocystis pyrifera. Haplotypes were obtained from Macaya et al. (2010) and Durrant, Barrett, Edgar, Coleman, & Burridge (Citation2015), in which each haplotype represented only one sequence. Mutations are shown as hatch marks in connecting lines. Haplotypes are shaded according to geographic origin. (c) Whole-genome alignment built with MAUVE. Locally Collinear Blocks (LCBs; light red) show high similarities between genomes from southern and northern hemisphere individuals. Below LCB, gene synteny of each genome is shown: ribosomal RNA genes in red, coding genes in white and transfer RNA genes in green. Orange blocks in chloroplast genomes indicate repeat regions.
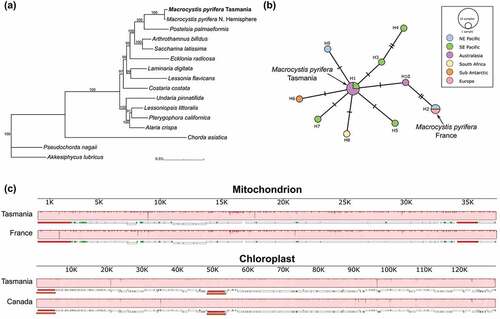
Figure 4. Genetic variation distribution of chloroplast and mitochondrial coding proteins. (a) uncorrected pairwise divergence, (b) synonymous substitution rate and (c) nonsynonymous substitution rate.
Table 1. The top 10 protein genes with the highest nonsynonymous substitution rates in chloroplast and mitochondrial genomes. dN, nonsynonymous substitution rates; dS, synonymous substitution rates.
Supplemental Material
Download PDF (112.8 KB)Supplemental Material
Download PDF (176 KB)Supplemental Material
Download PDF (276.4 KB)Data availability statement
The data that support the findings of this study are openly available in GenBank (https://www.ncbi.nlm.nih.gov/genbank), accession number ON227496 for mitochondrion and ON227495 for chloroplast.