Figures & data
Figure 1. (a) The indoor MPBR cultivation system during an experiment. The sleeves, filled with 5 l ASW (no water exchange during cultivation, aeration rate of 1 l min−1), were installed in a room with controlled temperature (21-22°C) and light (14:10 light: dark cycle, 80–110 µmol photons m−2 s−1). Ulva rigida initial stocking density was 5 g FW l−1. (b) A front view sketch of a single MPBR reactor.
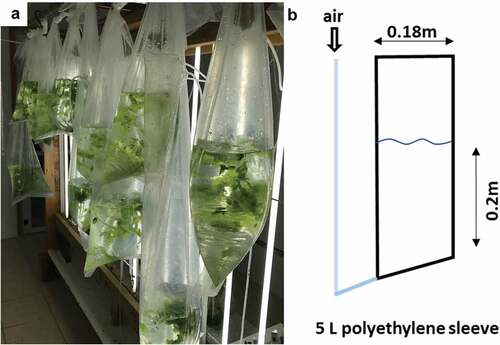
Table 1. Fertilization concentrations and frequencies of the indoor MPBR experiment.
Table 2. Biomass and water sampling frequencies.
Table 3. Data used for calibration.
Table 4. Minimum model error and optimized parameters.
Figure 2. Illustrated sensitivity of simulated biomass production (black circles) and N content (blue stars) to model parameters, as measured by the Sobol method.
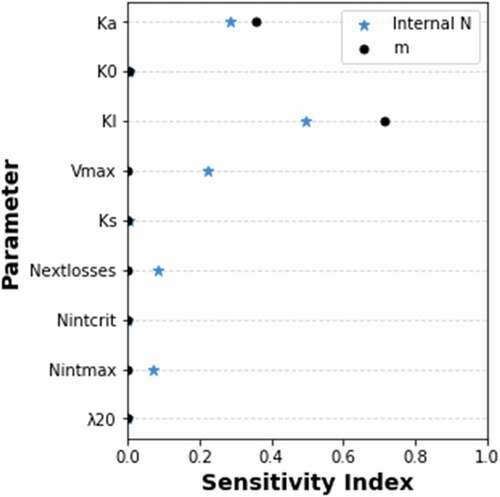
Figure 3. Cultivation of Ulva rigida under starvation conditions in the controlled indoor MPBR. a) measured growth rates between days 7 and 24 of the experiment. DGR results from day 7, used also in the simulation, are marked with black stars, whereas the rest of the results are marked with black circles. b) Model timewise simulation of Ulva cultivation under starvation conditions for a period of three weeks. Two variables are followed: Nint (% g N g DW−1, top row) and m (g DW l−1, bottom row). Initial conditions: 0.15 g DW l−1, 3.19% g N g DW−1. Empirical data points are presented in grey circles (initial Nint) and in black stars (Nint and m after 168 hours).
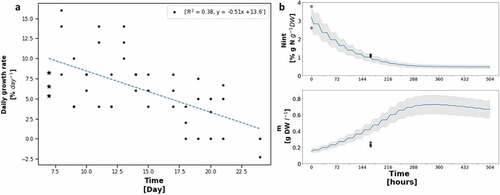
Table 5. Contribution of the different fertilizing components.
Figure 4. Daily growth rate (a), internal N (b) and nitrogen use efficiency (c) of Ulva rigida cultivation in the indoor MPBR sorted by fertilization duration. Asterisks indicate statistical significance of difference with ****p < 0.0001, calculated by the two-tailed Mann-Whitney U test. #Samples: 4 hours (blue): 12; 168 hours (green): 70–75.
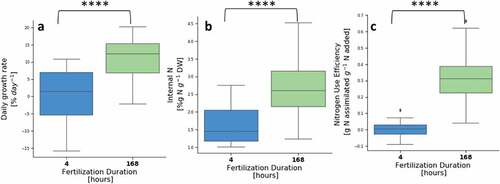
Figure 5. Model timewise simulation of Ulva spp. cultivation in the indoor MPBR for two/three consecutive weeks. Fertilized for a duration of 4 hours with 500 (a) or 2000 (b) µM-NH4 twice a week, or for a duration of 168 hours with 1000 µM-NH4 once a week (c), 500 µM-NH4 twice a week (d), 500 µM-NH4 three times a week (e) and 2000 µM-NH4 once a week (f). Three variables are followed: (µM-NH4, top rows),
(% g N g DW−1, middle rows) and m (g DW l−1, bottom rows). I.C: 0.15 g DW l−1 Ulva rigida, and internal N levels of: 1.85% g N g DW−1 (a, b) and 2.05–2.32% g N g DW−1 (c-f). Dashed lines represent the addition or removal of NH4 (blue) and biomass harvesting back to initial weight (green). Empirical data points include calibration data (black dots), validation data (yellow stars) and data from samples that were suspected of sporulation (red dots, excluded from error calculation).
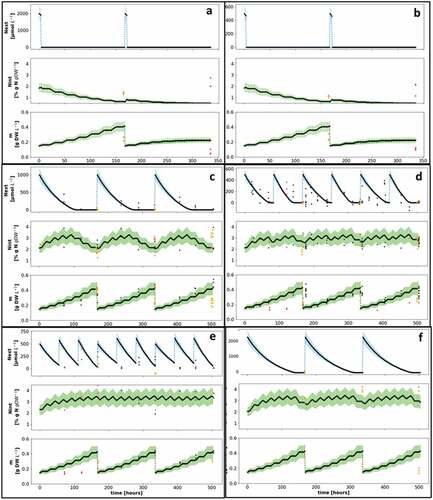
Figure 6. Daily growth rate (a), internal N (b) and nitrogen use efficiency (c) of Ulva sp. cultivated in indoor aerated sleeves, sorted by total weekly added nutrients. Asterisks indicate statistical significance with *p < 0.05, ***p < 0.001 and ****p < 0.0001, calculated by the two-tailed Mann-Whitney U test. Sample numbers: 4 hours: 6 for each week; 168 hours: 34–39 for each week.
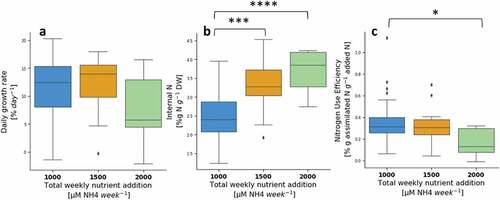
Figure 7. Daily growth rate (a), internal N (b) and nitrogen use efficiency (c) of U. sp. cultivated in the indoor MPBR with a total weekly addition of 1000 µM NH4 week−1, sorted by fertilizing concentration amplitude [µM NH4]. Box plots are based on data from experiments #1–5, whereas the dots present data only from experiment #5. Red dots are measurements from the first week of experiment #5. Sample numbers: 200 µM NH4: 3 for each week; 500 µM NH4: 13–17 for each week, and 1000 µM NH4: 11 for each week.
![Figure 7. Daily growth rate (a), internal N (b) and nitrogen use efficiency (c) of U. sp. cultivated in the indoor MPBR with a total weekly addition of 1000 µM NH4 week−1, sorted by fertilizing concentration amplitude [µM NH4]. Box plots are based on data from experiments #1–5, whereas the dots present data only from experiment #5. Red dots are measurements from the first week of experiment #5. Sample numbers: 200 µM NH4: 3 for each week; 500 µM NH4: 13–17 for each week, and 1000 µM NH4: 11 for each week.](/cms/asset/cfb4ecf7-7e9b-4d16-b3a3-ca9330cb41dc/tapy_a_2224423_f0007_oc.jpg)
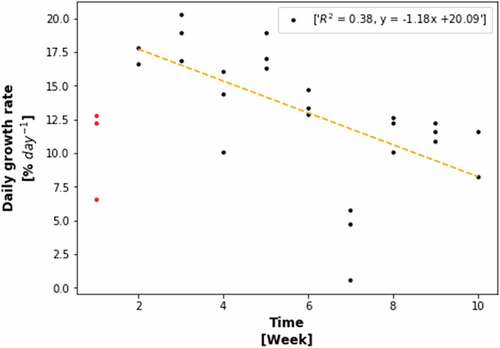
Figure 8. Daily growth rate vs week of cultivation in a ten-week Ulva sp. cultivation experiment with a weekly treatment of harvesting back to initial weight, water replacement, and fertilizing (1000 µM NH4). Results from the first week (red) were excluded from the trend line.