Figures & data
Table 1. Culture conditions used for each stress.
Figure 1. Box plots summarizing the growth rates of (A) Nannochloropsis oculata, (B) Dunaliella primolecta, and (C) Phaeodactylum tricornutum grown under varying conditions with box plots showing the 25–75% range, median values as thick lines and mean values as solid squares. Conditions are as follows: NaNO3 (grey); control (8.82 × 10⁻⁴ M), low (8.82 × 10⁻⁵ M), high (8.82 × 10⁻³ M); NaCl (red); control (24 g l-1), low (12 g l-1), high (36 g l-1), deplete (0 g l-1); salinity (blue); control (43 ppt), low (4.3 ppt), high (86 ppt); and pH (green); control (7.6), low (4), high (10). p-values are based on a t-test between condition and control for each stress.
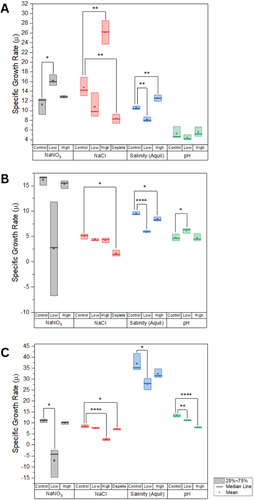
Figure 2. (A) bar chart showing the distribution of MS/MS features across strains: P = Phaeodactylum tricornutum, orange; D = Dunaliella primolecta, green; N = Nannochloropsis oculata, blue; D+P = features shared between D. primolecta and P. tricornutum, green and orange stripes, D+N = features shared between D. primolecta and N. oculata, green and blue stripes, N+P = features shared between N. oculata and P. tricornutum, blue and orange stripes, D+N+P = features shared between all three strains, yellow. (B) bar chart of the percentage of MS/MS features only detected in response to specific stresses; varying salinity (Aquil synthetic seawater), nitrate concentrations, NaCl concentrations, and pH. The percentages of total MS/MS features are listed above each bar.
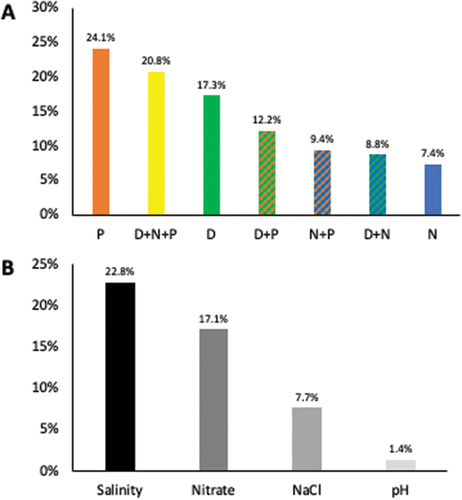
Figure 3. Pie charts illustrating the distribution of MS/MS features as percentages (given in figure) for all three strains under all four stresses: (A) Nannochloropsis oculata grown under varying salinity, (B) Dunaliella primolecta grown under varying salinity, (C) Phaeodactylum tricornutum grown under varying salinity, (D) N. oculata grown under varying NaCl concentrations, (E) Dunaliella primolecta grown under varying NaCl concentrations, (F) P. tricornutum grown under varying NaCl concentrations, (G) N. oculata grown under varying nitrate concentrations, (H) D. primolecta grown under varying nitrate concentrations, (I) P. tricornutum grown under varying nitrate concentrations, (J) N. oculata grown under varying pH, (K) D. primolecta grown under varying pH, and (L) P. tricornutum grown under varying pH.
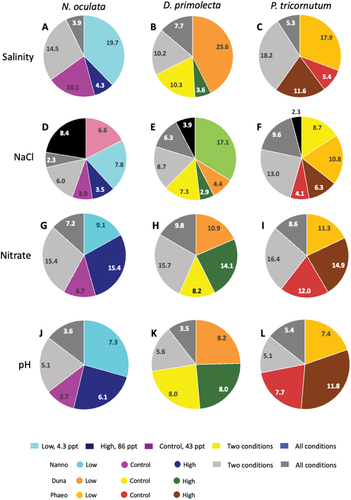
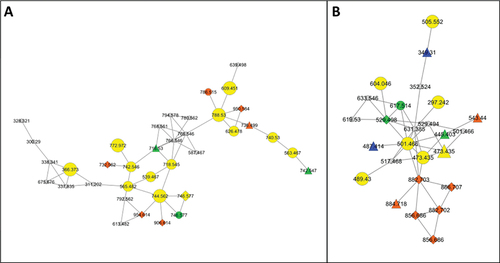
Figure 4. Examples of molecular families detected under specific conditions: (A) metabolites only produced by Phaeodactylum tricornutum (orange), Nannochloropsis oculata (blue) and Dunaliella primolecta (green) under low (diamonds) or high (triangles) salinity conditions. Metabolites in orange are only produced by P. tricornutum with diamonds representing metabolites only produced under low salinity, (B) metabolites only produced by P. tricornutum (orange) under low salinity (diamonds) or high salinity (triangles), (C) molecular family produced in response to low salinity by N. oculata, (D) molecular families produced in response to low salinity by D. primolecta.
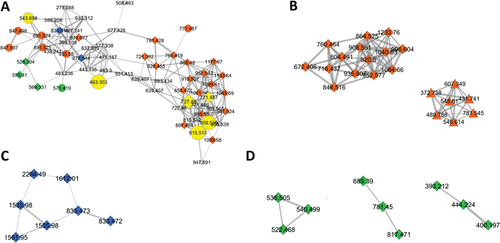
Figure 5. Metabolites only produced by Phaeodactylum tricornutum (orange), Nannochloropsis oculata (blue) and Dunaliella primolecta (green), or by multiple strains (yellow) under low (diamonds) or high (triangles) nitrate conditions.
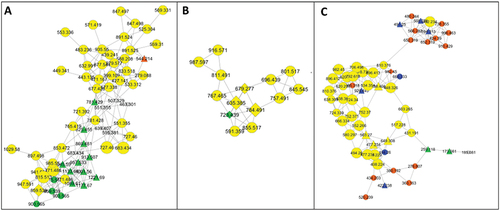
Figure 6. Metabolites only produced by Phaeodactylum tricornutum (orange), Nannochloropsis oculata (blue) and Dunaliella primolecta (green), or by multiple strains (yellow) under acidic (diamonds) or basic (triangles) pH conditions.