Figures & data
Figure 1. The Grenoble employment catchment area: location, physical geography and administrative boundaries.
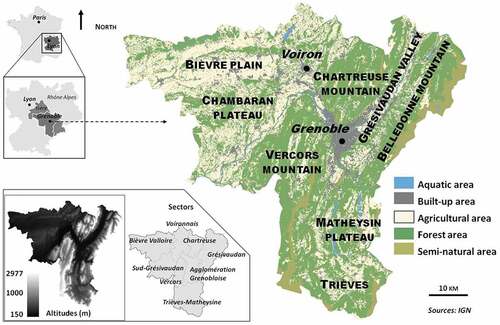
Table 1. First column: Panel of selected ES; second column: indicator used to quantify the related ES; third column: model type according to Lavorel et al. (Citation2017); fourth column: environment for ES bundle analysis (P: periurban bundle; F: forest bundle; R: and mountain rural bundle).
Figure 2. Map produced by the 12 ES models. Model specifications are provided in and Suppl. Mat. S3.
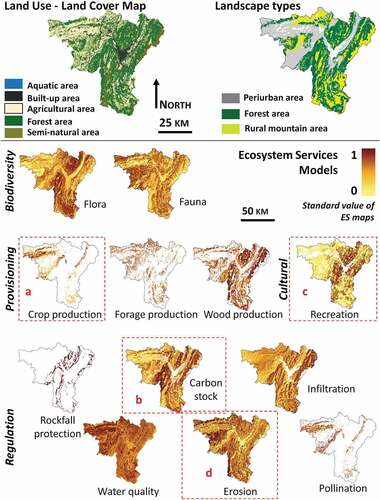
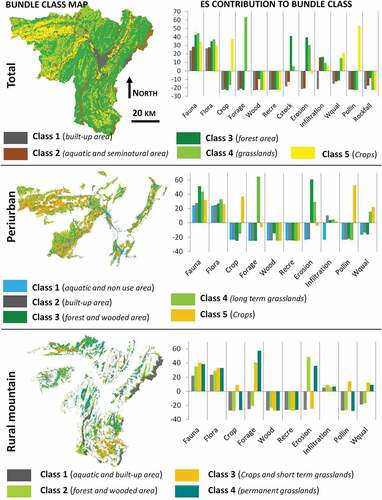
Figure 3. ES bundle analysis for the whole region (top), the periurban (middle) and mountain rural (bottom) landscape types: bundle maps and contribution of individual ES to the statistic definition of classes shown as mean deviation histograms (where Fauna = Fauna, Flora = Flora, Crop = Crop production, Forage = Forage Production, Wood = Wood production, Recre = Recreation, Eros = Erosion, Infilt = Infiltration, WQual = Water Quality, Pollin = Pollination).