
Figures & data
Figure 1. Location of the Hawassa catchment and learning watersheds
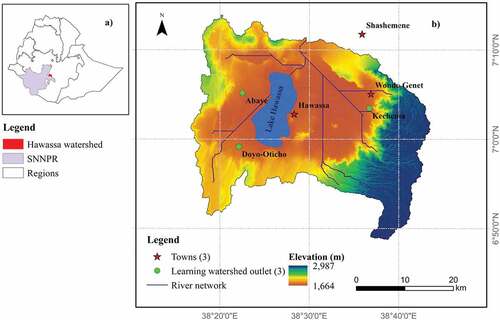
Figure 2. Stages used in conducting stakeholder analyses (adapted from Reed et al. Citation2009)
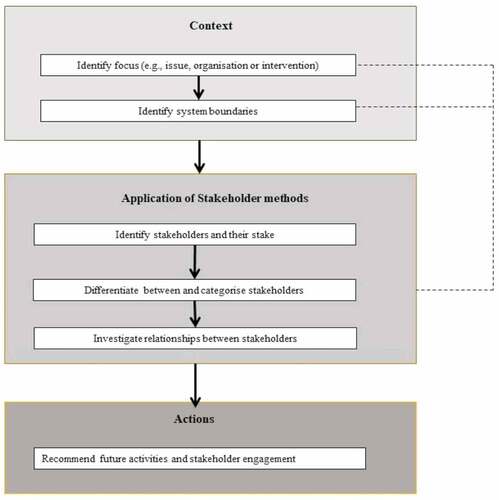
Table 1. Methods of data collection, issues discussed, searched, and observed as well as linked objectives and research questions
Table 2. Definition of some of the words used in data collection and analysis (adapted from Zimmermann and Claudia Citation2007; Matti Citation2009)
Figure 3. Gully erosion in the catchment dissecting agricultural lands and villages (Photo credit: Wolde Mekuria and Amare Haileslassie)
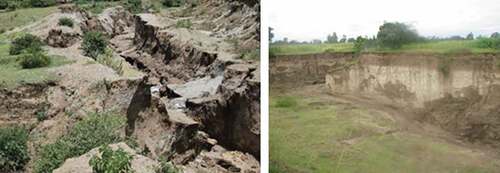
Table 3. Agenda and forms of stakeholder’s involvement in natural resources management
Figure 4. Graphic representation of the core functions of identified stakeholders. The full names of the stakeholders are presented in
Figure 5. Strategic options of selected key and secondary stakeholders. DV refers to development vision, OE – operational effectiveness, FI – flexibility and innovation, CF- contractual fidelity, CN-communication, RL – relationships, MG – management, TR – trust, CN – conflicts, and CE – capitalising on experience. The degree of agreement of each stakeholder with the statements (or strategic options) varied between – and ++. The sum of the ratings of the 9 selected stakeholders could range from −18 to 18. S1 refers to Agriculture and natural resource offices at different levels, S2 – Environment and Forest Protection offices at different levels, S3 – South Agricultural Research Institute, S6 – Rift Valley Basin development office, S12 – Hawassa city forest, environment and climate change regulation office, S13 – German International Cooperation (GIZ), S14 – SOS Sahel, S15 – People in Need, and S17 – Population, Health and Environment (PHE) – Ethiopia consortium
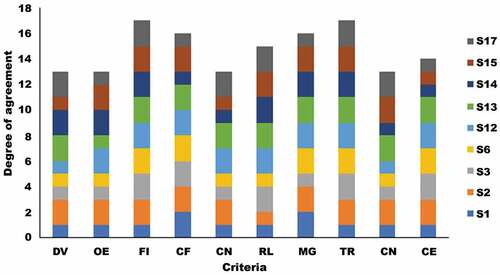
Figure 6. The perceived stakeholders’ legitimate power based on seven types of authority
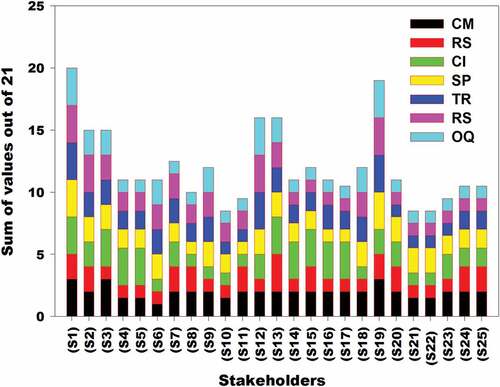
Figure 7. Analysis of stakeholders’ interest and influence. Scale for interest: +2 strong approval, active participation; +1 moderate approval; participation variable; 0 indifferent, waits and observes further developments; −1 moderate rejection; passive participation; −2 strong rejection. Scale for influence: +2 very influential; +1 influential; 0 influential in some areas; −1 little influence: −2 minimal or no influence on progress towards the implementation of the planned project activities
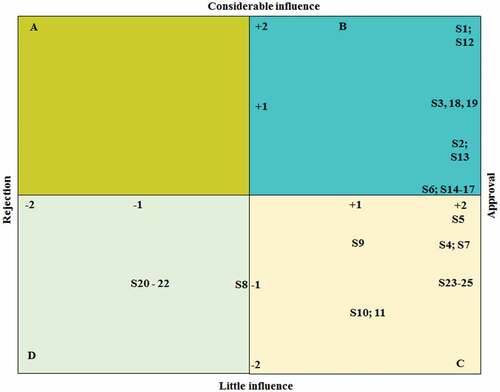
Table 4. The level of trust among the different stakeholders
Table 5. Perceived access to and control of resources and competencies