Figures & data
Table 1. Four governance modes that guide the analysis. Examples in the end of each description are based on the literature review of this paper
Figure 1. (a) The number of publications on ES (brown dots) and of publications including the terms ‘governance’ and ‘ecosystem services’ in their abstract (blue square). (b) The percentage of all ES publications that include governance has increased over time (P = 0.001). The gray line shows a best fit line from a linear regression
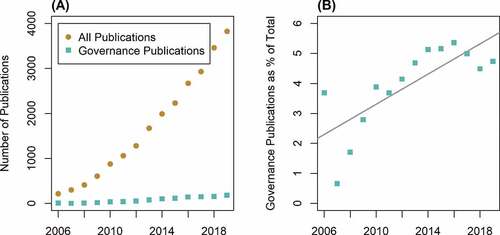
Figure 2. Type of publication between 2006 and 2019 (n = 262). Shown values are relative for the year
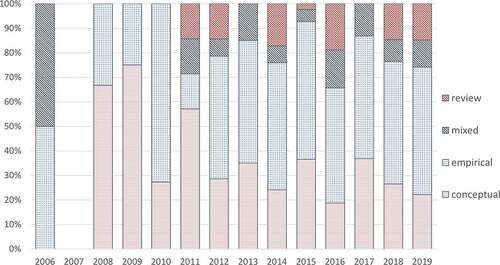
Figure 3. World map showing the distribution of empirical ES governance studies. The colour intensity illustrates the number of studies within a given country. There were 17 studies at the supranational or global scale that are not shown on the map
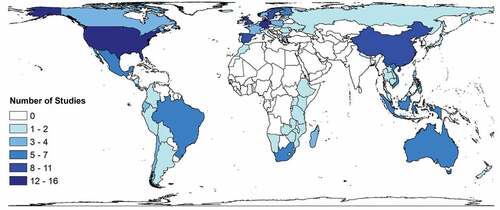
Figure 4. The frequency of each of the four modes of governance in studies by scale, grouped according to authors’ own spatial categories: local (n = 68) – villages, cities and municipalities; region (n = 90) – counties, states, national parks, ecoregions; country (n = 53) – political unit; supranational (n = 12) – multiple countries, e.g. European Union, South America; global (n = 6) – global perspective, no spatial focus
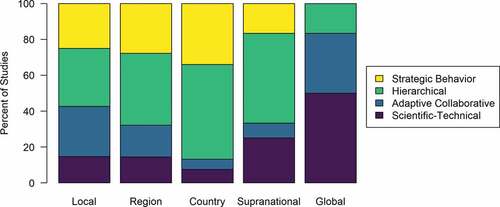
Figure 5. Links between data collection methods (left-hand side) and data analysis methods (right-hand side) of qualitative (top, n = 95), quantitative (middle, n = 23), and mix-methods publications (bottom, n = 39) in our review. Note that numbers represent the number of links between data collection and data analysis methods, not the number of papers (e.g. in the same paper, ‘interviews’, a data collection method, can be linked to both ‘scenarios’ and ‘content analysis’, which are data analysis methods)
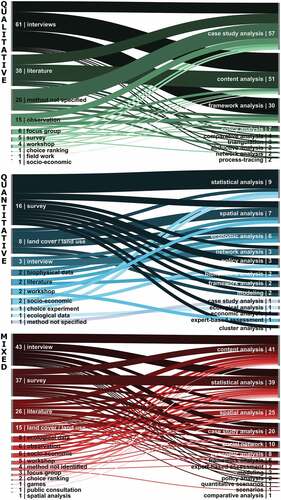
Figure 6. Occurrence of different governance modes in the reviewed publications (n = 157). The size of the circles illustrates how often the (combination of) governance modes occurred in the reviewed sample, which is also given by the number. 1* represents the one publication combining the three governance modes adaptive, hierarchical and strategic behavior. 1^ represents the one publication combining all four governance modes
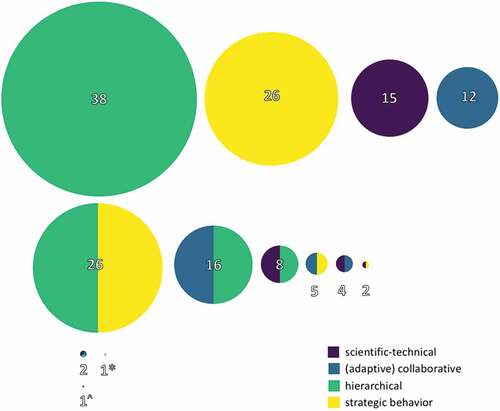
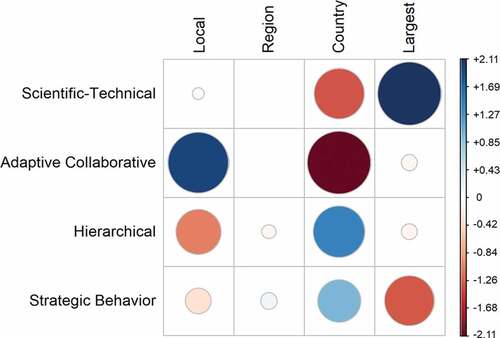
Figure 7. Residuals from a chi-square contingency test, where dark blue colours indicate more papers published than expected for a particular governance type at that spatial scale, and dark red colours indicate fewer papers published than expected. The ‘Largest’ scale indicates that supranational and global scales were combined for the analysis, but results in this column should be interpreted with caution since a few expected values were less than five