Figures & data
Table 1. Case study characteristics and overview of methods applied
Figure 1. Overview of the study area in Kenya, Mozambique, and Madagascar, showing the approximate locations of the cases
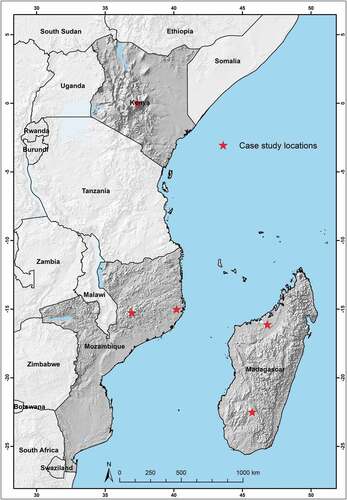
Table 2. LULC change to LAI and small-scale cropland (SSC) as a percentage of the LAI and new cropland areas, respectively, aggregated for each case. The same statistics are disaggregated for each LAI in Table S1 in the annex
Table 3. Reported changes in small-scale farmers’ agricultural land use. Percentage values are presented only for samples larger than five
Figure 2. LULC change maps of the analysed Cases and LAIs. The maps follow the sequence given in . Kenya: Case 1 and 2, Mozambique: Case 3 and 4, Madagascar: Case 5 and 6. The maps indicate only the most important class changes
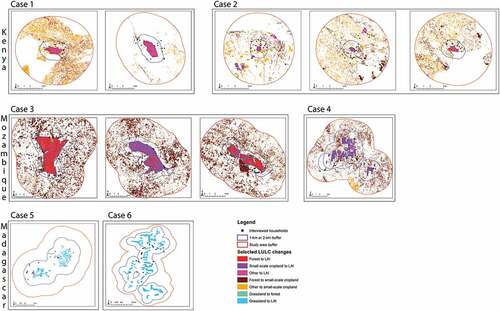
Table 4. Reported changes in agricultural land management. Only responses with a total percentage value five or more are presented, and percentage values are given only for samples larger than five
Table 5. Perceived changes in tree cover in the landscapes surrounding the LAIs. Percentage values are given only for samples larger than five
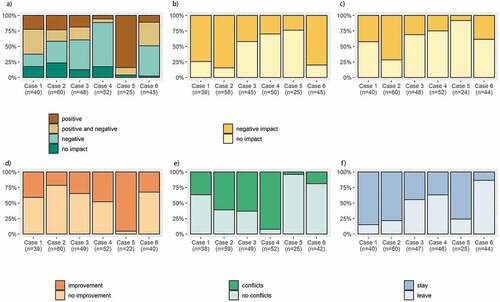
Figure 3. Perceived impacts of LAIs on (a) households, (b) the environment, (c) people’s health, (d) infrastructure, and (e) conflicts, as well as (f) overall preference of households for LAI companies to stay or leave; all expressed as percentages of households reporting impacts or no impacts (a–e) or a certain preference (f)