Figures & data
Figure 1. Los Dinamos Recreational Park, showing sub-polygons, climbing sites, and points of interest
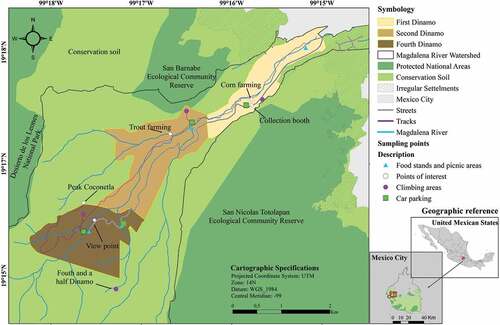
Table 1. Social value definitions (adapted from Brown and Reed Citation2000) used in the survey
Figure 2. Geo-referenced photographs within the sub-polygons. The Magdalena River Watershed is rotated 90° to the left (east) to highlight visually the steepness of the valley and display the photographs from right (lowest elevation point) to left (highest elevation point)
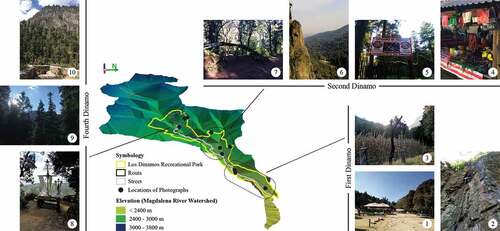
Table 2. Socio-demographic characteristics of visitors. NA represents number of rock climbers (A), and NB number of non-rock climbers (B). Within both groups, origin, gender, marital status, and having children were extrapolated to 100%, whereas age group, educational level, occupation, and income group present the most frequent answer. A Chi-square test of independence with an alpha level of .05 was used
Table 3. Cross-tabulations of visitor characteristics. An alpha level of .05 was used for all statistical tests
Figure 3. Visitors´ opinion on activities performed in Los Dinamos Recreational Park. ‘A’ represents the visitor group of rock climbers, ‘B’ those of non-rock climbers
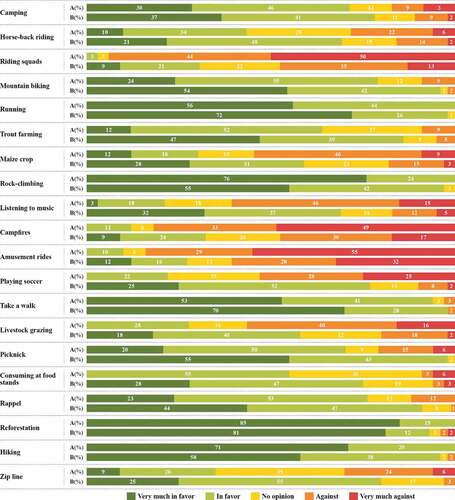
Table 4. Social values ascribed to photographs were counted and calculated through a chi-square test with an alpha level of .05
Table 5. Relation between landscape characteristics and social values (Source: 1Google Earth Pro 2019, 2GDF (Citation2012), and 3self-generated data)
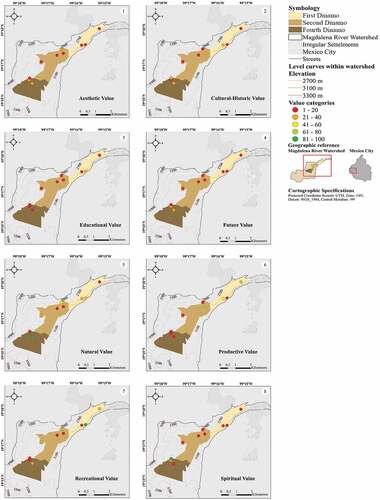
Figure 4. Perception of social values in the three sub-polygons based on a photograph-based analysis. Each map shows one social value and location of ten photographs