
Figures & data
Figure 1. Benefits of assessing ecosystem service bundles.
Figure 2. Ecosystem services indicators represent different aspects of the relationship between people and their environment.
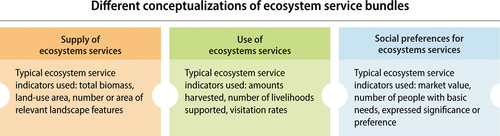
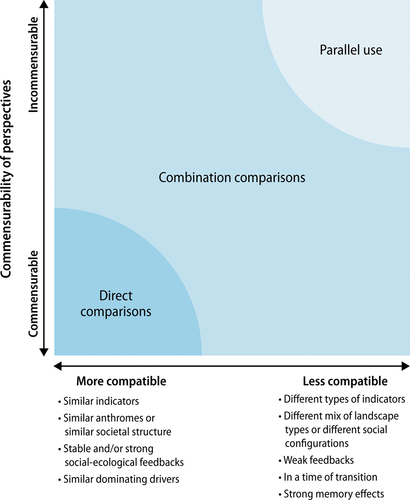
Figure 3. Comparability of ecosystem service bundle studies Three types of comparisons are possible (direct comparisons, combination comparisons, and parallel use) based on the commensurability of conceptualization of ecosystem services bundles taken by each study and the compatibility of the indicators, scales and methods used. The figure is adapted from Kronenberg and Andersson (Citation2019).
Supplemental material