
Figures & data
Figure 1. Map of Yala wetland showing its location on the shores of Lake Victoria and locations of the stakeholder workshops.
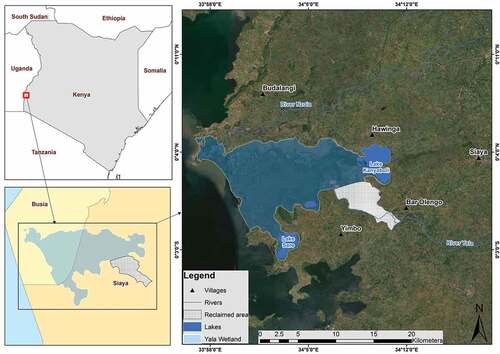
Table 1. ES categories for Yala wetland with definitions modified from (Kandziora et al. Citation2013) and corresponding supporting literature for each ES denoted by a number
Table 2. Matrix showing flow of ES in Yala wetland. Mean scores: 0 = no flow, 1 = very low flow, 2 = low flow, 3 = medium flow, 4 = high flow, 5 = very high flow
Figure 2. Map showing LULC classes in Yala wetland.
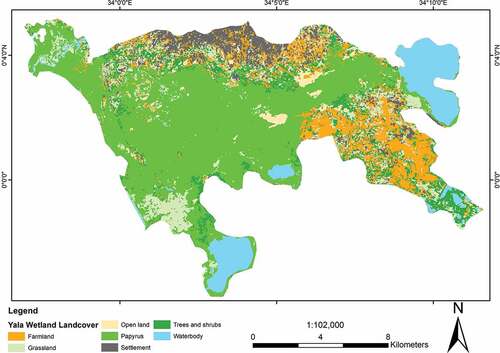
Figure 3. Proportions of respondents who favoured high flows of ES over selected LULC classes (NB: High flows here are defined as a score of 4 or 5 on the matrix).
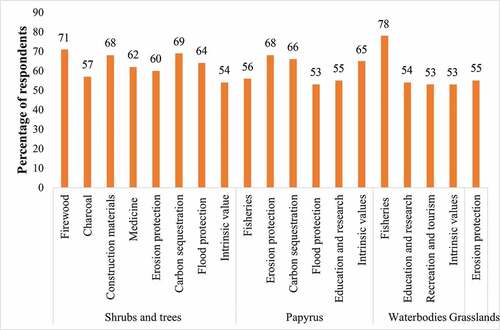
Figure 4. Map showing flow of provisioning services in Yala wetland.
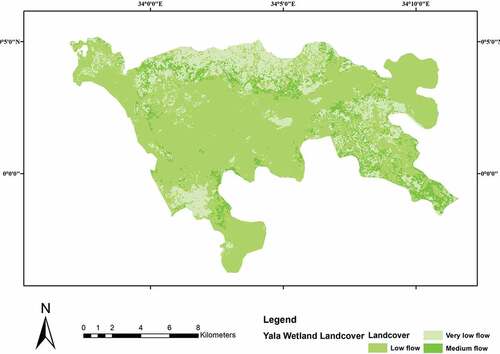
Figure 5. Map showing flow of regulating services in Yala wetland.
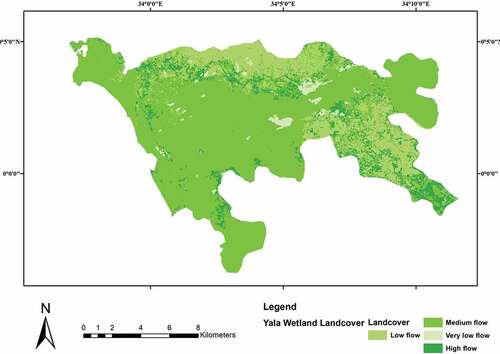
Figure 6. Map showing flow of cultural services in Yala wetland.
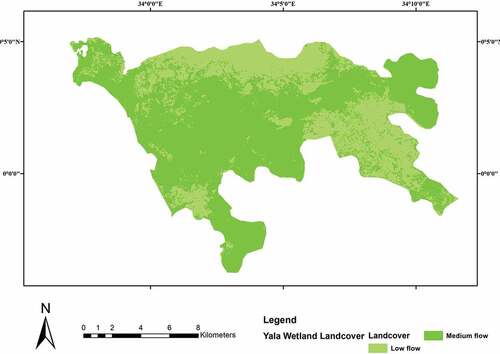
Table 3. Results of one-way MANOVA test for the effects of expertise on scoring of ES flows (*denotes significance) η2 = partial eta, n = 99
Table 4. Results of one-way MANOVA test for the effects of gender on scoring of ES flows (*denotes significance) η2 = partial eta, n = 127
Table 5. Results of one-way MANOVA test for the effects of location on scoring of ES flows (*denotes significance) η2 = partial eta, n = 126
Table A1. Pairwise comparisons of Tukey’s HSD (* denotes significance at 0.05 level)