Figures & data
Figure 1. Map displaying location of study site within Östergötland County, Sweden, with inset displaying Mjölby kommun and 2 kilometer buffer zone used for data analysis.
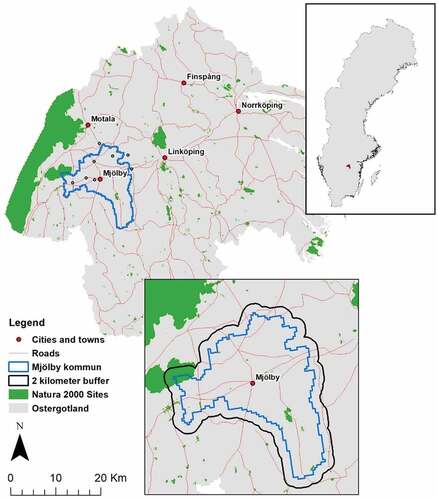
Table 1. Definitions of landscape values provided in survey, adapted from Plieninger et al. (Citation2018)
Table 2. Socio-demographics of sample compared to statistics from Mjölby kommun and Östergötland County
Figure 2. Density-based clusters indicating perimeters of highly value-dense areas in Mjölby kommun. Includes main CORINE land cover classes. Inset map displays Västra Harg cluster, with the Västra Harg Natura 2000 site.
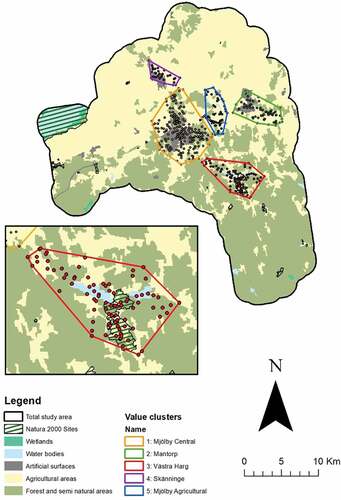
Figure 3. (a) Percentages of values assigned by those more knowledgeable and less knowledgeable about forestry in cluster 1. Values outlined in red indicate significant proportional differences. MK and LK refer to respondents more and less knowledgeable about forestry, respectively. (b) Percentages of values assigned by those more and less knowledgeable about non-native biodiversity in cluster 3. Values outlined in red indicate significant proportional differences. MK and LK refer to respondents more and less knowledgeable about non-native biodiversity, respectively.
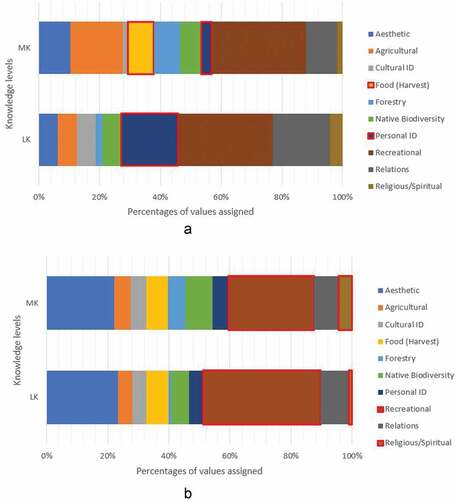
Table 3. Area calculations of landscape use types in each density-based cluster. All areas are in hectares (ha). The largest land-use types are indicated in bold
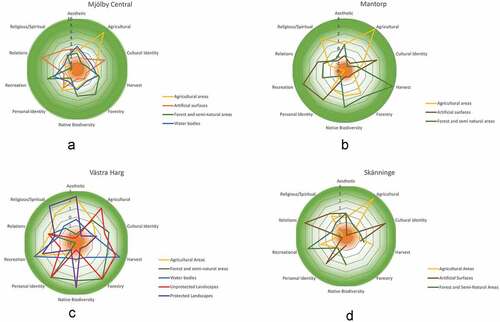
Figure 4. (a) Landscape values assigned to landscape uses in the Mjölby Central density cluster. (b) Landscape values assigned to landscape uses in the Mantorp density cluster. (c) Landscape values assigned to landscape uses in the Västra Harg density cluster. (d) Landscape values assigned to landscape uses in the Skänninge density cluster. Concentric circles represent the ASR, for which significant results are defined at ± 2. Positive associations are indicated in green, moving to negative associations in red towards the center.