
Figures & data
Figure 1. Comparisons of cherry blossom trees in Japan. (a) Common cultivar (Cerasus × yedoensis (Matsum.) Masam. et Suzuki) planted along a street in Tsukuba city, Japan. (b) Wild cherry blossoms (Cerasus jamasakura (Siebold ex Koidz.) H. Ohba and Cerasus leveilleana (Koehne) H. Ohba) in Sakuragawa city, Japan. Left: A natural forest landscape in Hirasawa. Right: Planted trees in Isobe, which was designated as a National Place of Scenic Beauty and a National Monument by the Agency for Cultural Affairs.
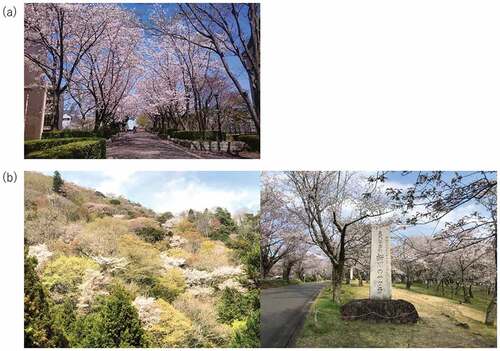
Figure 2. Map of Japan and inset of Sakuragawa city in Ibaraki prefecture showing the major geographic features and land uses.
Table 1. Characteristics of respondents
Figure 3. Results of the questionnaire survey about respondents’ perceptions and experiences regarding wild cherries. (a) Q2-1 How often do you go cherry blossom viewing? (b) Q2-2 What image do you have of wild cherries? (c) Q2-3 Which do you like better, Cerasus × yedoensis or wild cherries? (d) Q2-4 What kind of activities are you interested in regarding the conservation of wild cherries? (Respondents were allowed to choose multiple answers.) (e) Q2-5 Do you have an image of Satoyama?.
Figure 4. Averaged allocation (%) to eight types of ecosystem services according to the three groups of respondents.
Figure 5. Distribution of values of ecosystem services derived from wild cherries according to residents. Grid cells with a distribution probability of 0.2 or higher are colored. The four areas in A) are famous scenic areas.
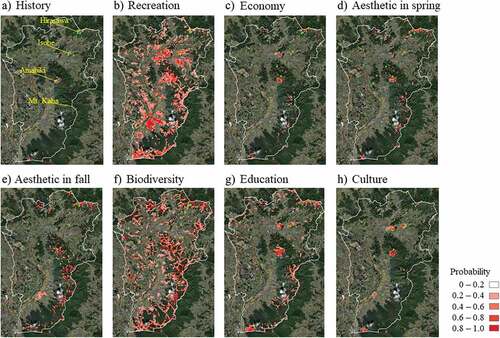
Figure 6. Distribution of values of ecosystem services derived from wild cherries according to tourists. Grid cells with a distribution probability of 0.2 or higher are colored.
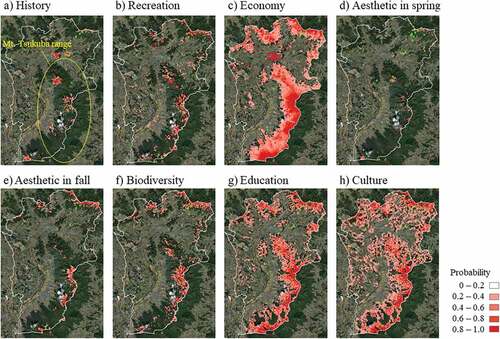
Figure 7. Distribution of values of ecosystem services derived from wild cherries according to high school students. Grid cells with a distribution probability of 0.2 or higher are colored.
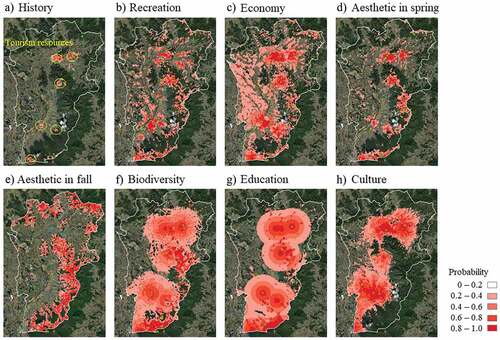
Table 2. Estimates of relative contributions of environmental variables to the Maxent model. See for the corresponding maps. DTF: Distance to Forest, DTT: Distance to Tourism resources, DTR: Distance to Road, DTW: Distance to Water, ELEV: Elevation, SLOPE: Slope, LAND: Land use type, VG: Vegetation