
Figures & data
Figure 1. Diagram showing assessed outcomes, predictors, and confounders of the three studied hypotheses.
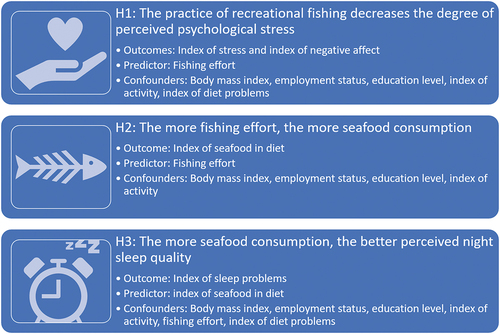
Table 1. Physical and socioeconomic characteristics of the participants, and results of the indices obtained from fishers’ responses to a self-administrated questionnaire. We show the Cronbach’s alpha (α) of the indices.
Figure 2. Partial effect of fishing effort on the index of stress and on the index of negative affect of recreational fishers. We show observations (dots), predictions (thick lines) and 95% confidence intervals (thin lines) estimated by unadjusted GLM and TM, respectively. P-values, and goodness of fit of the GLM (R2) are also shown.
Table 2. Outputs of the GLM and TM fitted on the index of stress, index of negative affect, index of seafood in diet, and index of sleep problems. We show the estimated model coefficients, p-values and 95% confidence intervals for the different predictors of unadjusted, and of final adjusted models when available, and of significant confounders. The error and link structure, values of Akaike’s information criterion (AIC), and goodness of fit (R2) when possible, are also given (Q=quartile-factorized variable).
Figure 3. Partial effect of fishing effort on the index of seafood in the diet of recreational fishers. We show observations (dots), predictions (thick lines) and 95% confidence intervals (thin lines) estimated by unadjusted TM. P-value is also shown.
Figure 4. Output of a SIMPER procedure showing the contribution of each seafood species to differences in fishers’ index of sleep problems. The median of the index of sleep problems scores is shown with a dashed line.
Table 3. Output of a SIMPER procedure showing the average contribution of each food item of diet to differences in the tertile-factorized index of sleep problems (s=with sugar; c=with caffeine; sq=squeezed). The different food items have been ordered based on their average relative contribution.