
Figures & data
Table 1. Principles, criteria, and indicators (PC&I) used for evaluating governance quality.
Table 2. Number of respondents in survey 1 and survey 2 from August-September 2020.
Table 3. Indicator-wise questions.
Table 4. Overall, survey 1 and survey 2 results from the combined respondent of sectors on GFG, RPCP and NHP.
Figure 1. Combined rating by the indicator of the selected sector of respondents on GFG, RPCP, and NHP.
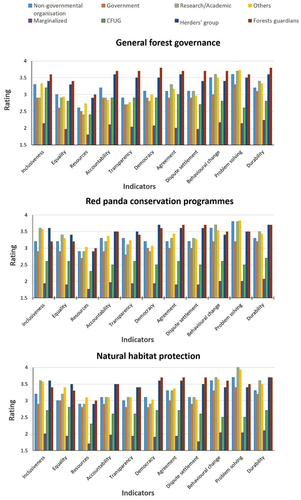
Figure 2. Distribution of respondents and chart of results ((a) East/West (b) geographic distribution and (c) major sectors ratings)) from survey 2.
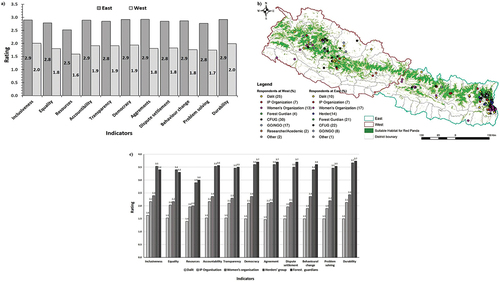
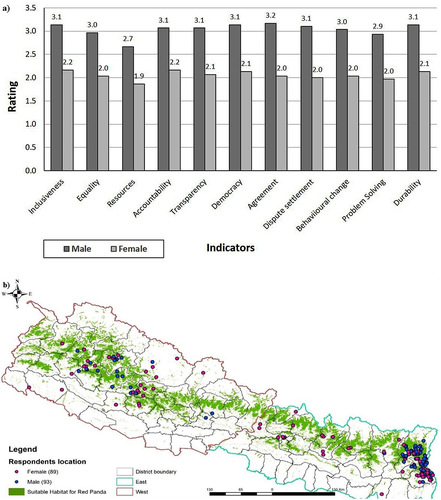
Figure 3. Geographical distribution of respondents and chart of ratings by gender (phone interview).
Supplemental material