
Figures & data
Figure 1. Map with the location and characteristics of the four case studies.
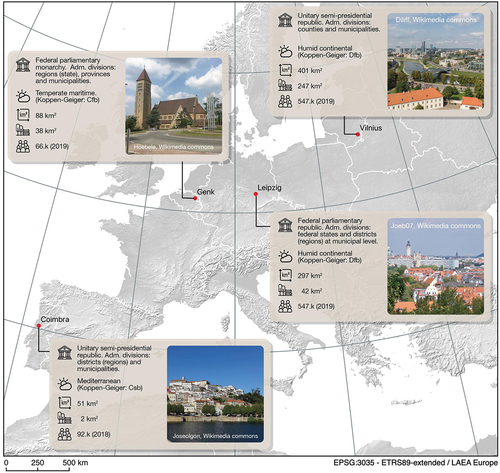
Figure 2. Methodological framework guiding the collection of data.
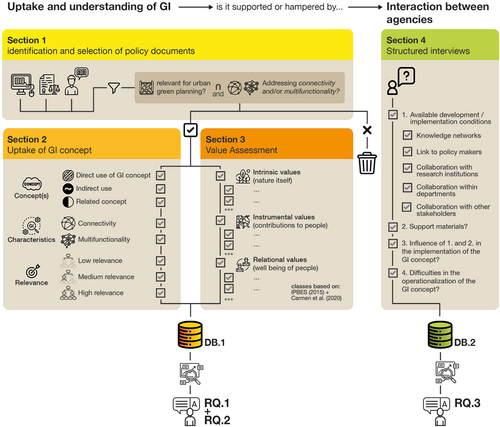
Table 1. Analytical framework for document analysis (adapted from the IPBES framework).
Figure 3. Types of document per governance level per case study. The inner donut presents the governance level and the outer donut shows the type of document at that governance level.
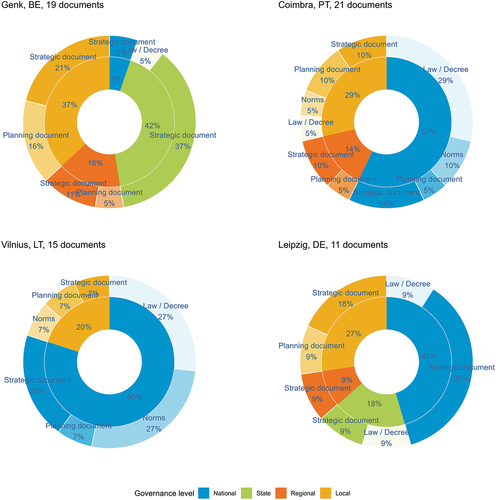
Table 2. Concepts related to GI used in policy documents. A distinction is made between before the release of the EC GI strategy (<2013) and after (2013–2019) to show the evolution of concepts used.
Figure 4. Number of policy documents over time (1995–2019) that mentioned GI directly, indirectly or if a related concept was used. The grey scale of the stacked bars reflects the relevance of GI (as defined in Supplementary Material 2).
Figure 5. Median score of all governance levels per case study for each nature/contributions/people value associated to GI or related concepts in the respective policy documents.
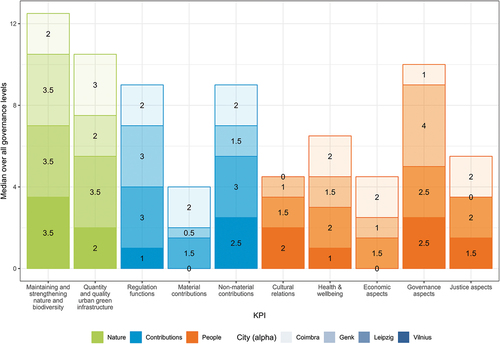
Table 3. Presence of interactions between agencies per CS bringing knowledge into local policy.