Figures & data
Figure 1. Conceptual framework of the interlinkages between BES dashboards and planning process, here the arrowhead symbolizes the streamlined horizontal progression of the planning process, depicting the transition from the planning context to decision making and governance. Each step in the cycle is vertically aligned to emphasize its direct linkages with the overarching context, design and development process of the dashboards.
Figure 2. Steps for identification and in-depth assessment of BES dashboard case studies.
Table 1. Review framework (categories in italics indicate that their anaylsis usually requires additional information beyond those available in the dashboard itself).
Figure 3. Spatial representation of selected BES dashboard case studies.
Table 2. Selected BES dashboards with full names, scale, URLs, and country information.
Figure 4. Results of BES dashboards context including level of decision making, targeted planning stages and purpose analysis.
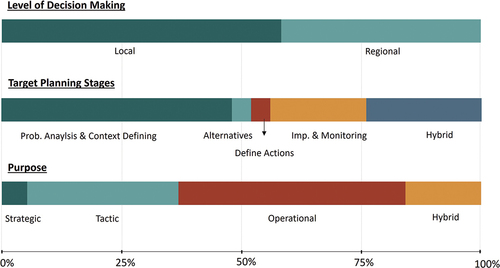
Figure 5. Distribution of findings of BES dashboard design features.
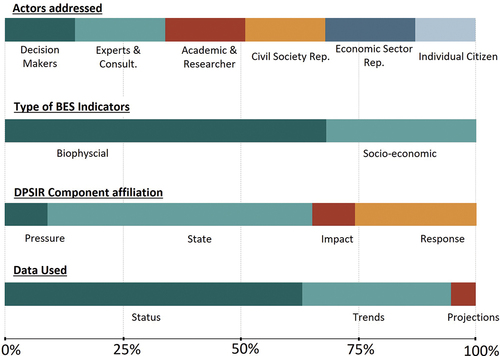
Figure 6. Distribution of findings of BES dashboard process features.
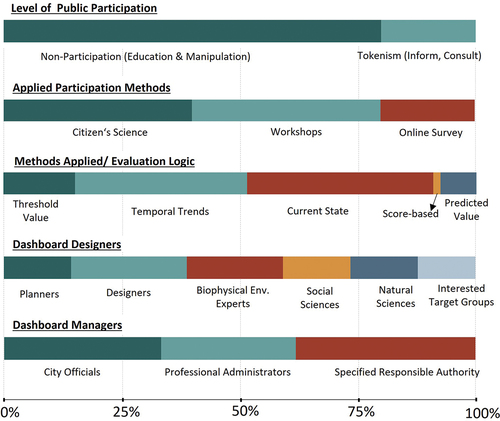
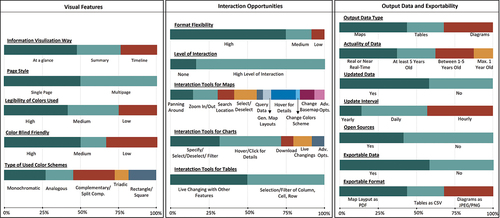
Figure 7. Dashboards outputs in alignment of planning outcomes; (a) visual features of dashboards, (b) interaction opportunities offered by dashboards, (c) output data and exportability features.