
Figures & data
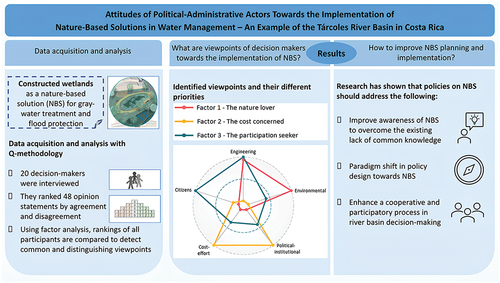
Figure 1. The Tárcoles River basin and the responsibilities of the subcommissions.
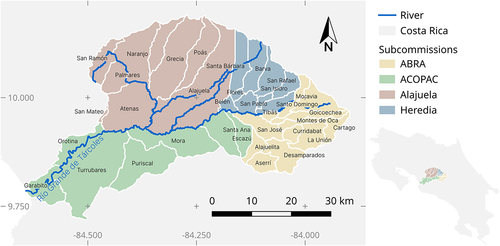
Figure 2. Grid used for sorting the 48 statements according to the participants’ individual highest agreement (+5) to highest disagreement (-5), whereby a predefined number of statements could be assigned to the single values.
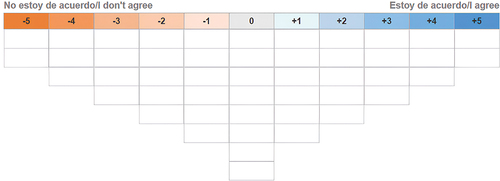
Table 1. Attributes of the extracted factors (viewpoints) F1, F2 and F3.
Table 2. Q-set formed by 48 statements (S1-S48), clustered by five categories. The values from −5 (highest disagreement) to 5 (highest agreement) indicate the respective factor scores of a statement.
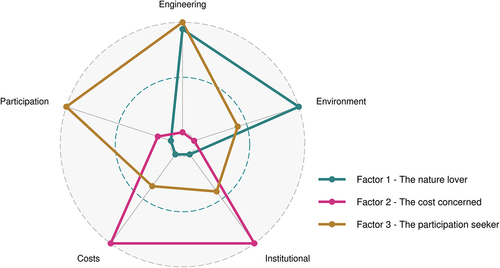
Figure 3. Illustration of prioritized categories per factor. Data based on the absolute sum of statement factor scores for each statement category per factor.
Appendix A
Download PDF (240.3 KB)Appendix B
Download PDF (126.4 KB)Appendix C
Download PDF (349.7 KB)Appendix D
Download PDF (130.7 KB)Data availability statement
The data that support the findings of this study are available from the corresponding author, BS, upon reasonable request.