Figures & data
Figure 1. Perceptions included in this study, derived from the Cognitive Model that differentiates perceptions based on level of abstraction, stability, and number (Stern et al. Citation1995; Schultz and Zelezny, Citation1999; Tung and Ritchie, Citation2011; Kendal et al. Citation2022).
![Figure 1. Perceptions included in this study, derived from the Cognitive Model that differentiates perceptions based on level of abstraction, stability, and number (Stern et al. Citation1995; Schultz and Zelezny, Citation1999; Tung and Ritchie, Citation2011; Kendal et al. Citation2022).](/cms/asset/528052df-c251-42ee-935b-b4e9b6e8999a/tbsm_a_2355272_f0001_b.gif)
Figure 2. Surveyed areas reflecting different municipal contexts (inner cores, middle, outer and regional cities) of the urban regions of Montreal, Toronto, and Vancouver.
![Figure 2. Surveyed areas reflecting different municipal contexts (inner cores, middle, outer and regional cities) of the urban regions of Montreal, Toronto, and Vancouver.](/cms/asset/abec5b63-2827-4084-9a3b-a35171283d3d/tbsm_a_2355272_f0002_oc.jpg)
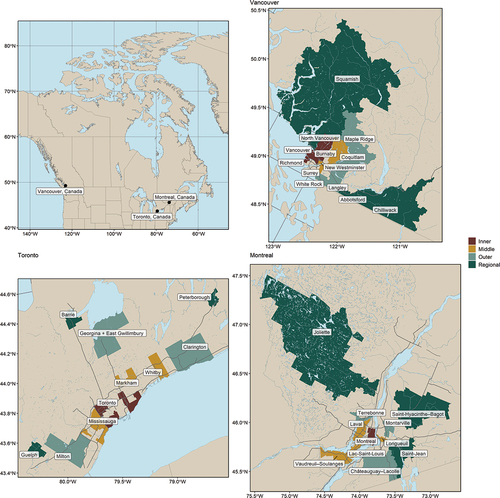
Table 1. Demographic and cultural profile of survey sample for Montreal (n = 1,703), Toronto (n = 2,015), and Vancouver (n = 1,737) regions and census data for the metropolitan areas.
Table 2. Average responses for value, beliefs, trust, and satisfaction factors, measured from 1 (low importance/agreement/satisfaction) to 5 (high importance/agreement/satisfaction).
Figure 3. Violin plots showing survey respondents assignment of importance for statements loading on each of the urban forest values factors, aggregated by the four municipal contexts (inner, middle, outer, regional), in each of the three regions (Montreal, Toronto, and Vancouver). The average (circle), interquartile range (box), and overall data distribution are depicted (Montreal n = 1,703; Toronto n = 2,015; Vancouver n = 1,737).
![Figure 3. Violin plots showing survey respondents assignment of importance for statements loading on each of the urban forest values factors, aggregated by the four municipal contexts (inner, middle, outer, regional), in each of the three regions (Montreal, Toronto, and Vancouver). The average (circle), interquartile range (box), and overall data distribution are depicted (Montreal n = 1,703; Toronto n = 2,015; Vancouver n = 1,737).](/cms/asset/012c3391-36ab-46a9-8d70-6bef3c6fbf20/tbsm_a_2355272_f0003_b.gif)
Table 3. 2-way ANOVA results for the geographic variables and perception measures.
Figure 4. Violin plots showing survey respondents level of agreement for statements loading on each of the urban forest beliefs and trust in municipality factors, aggregated by the four municipal contexts (inner, middle, outer, regional), in each of the three regions (Montreal, Toronto, and Vancouver). The average (circle), median (line), interquartile range (box), and overall data distribution are depicted (Montreal n = 1,703; Toronto n = 2,015; Vancouver n = 1,737).
![Figure 4. Violin plots showing survey respondents level of agreement for statements loading on each of the urban forest beliefs and trust in municipality factors, aggregated by the four municipal contexts (inner, middle, outer, regional), in each of the three regions (Montreal, Toronto, and Vancouver). The average (circle), median (line), interquartile range (box), and overall data distribution are depicted (Montreal n = 1,703; Toronto n = 2,015; Vancouver n = 1,737).](/cms/asset/84278011-b399-4f6c-b718-2c0b2853f411/tbsm_a_2355272_f0004_b.gif)
Figure 5. Violin plots showing survey respondents level of satisfaction for statements loading on each of the urban forest satisfaction factors, aggregated by the four municipal contexts (inner, middle, outer, regional), in each of the three regions (Montreal, Toronto, and Vancouver). The average (circle), median (line), interquartile range (box), and overall data distribution are depicted (Montreal n = 1,703; Toronto n = 2,015; Vancouver n = 1,737).
![Figure 5. Violin plots showing survey respondents level of satisfaction for statements loading on each of the urban forest satisfaction factors, aggregated by the four municipal contexts (inner, middle, outer, regional), in each of the three regions (Montreal, Toronto, and Vancouver). The average (circle), median (line), interquartile range (box), and overall data distribution are depicted (Montreal n = 1,703; Toronto n = 2,015; Vancouver n = 1,737).](/cms/asset/8245dfa0-28a7-4022-90b2-da8dba5de264/tbsm_a_2355272_f0005_b.gif)
Figure 6. Violin plots for survey responses to statements loading on each of the urban forest values, beliefs, trust and satisfaction measures, separated by English and French speakers. The average (circle), median (line), interquartile range (box), and overall data distribution are depicted (n = 5,455).
![Figure 6. Violin plots for survey responses to statements loading on each of the urban forest values, beliefs, trust and satisfaction measures, separated by English and French speakers. The average (circle), median (line), interquartile range (box), and overall data distribution are depicted (n = 5,455).](/cms/asset/7ce51276-727e-457c-932b-558e4af1beb5/tbsm_a_2355272_f0006_b.gif)
Figure 7. Violin plots for survey responses to statements loading on each of the urban forest values, beliefs, trust and satisfaction measures, separated by French or English as a second language (F/ESL) and non-F/ESL speakers. The average (circle), median (line), interquartile range (box), and overall data distribution are depicted (n = 5,455).
![Figure 7. Violin plots for survey responses to statements loading on each of the urban forest values, beliefs, trust and satisfaction measures, separated by French or English as a second language (F/ESL) and non-F/ESL speakers. The average (circle), median (line), interquartile range (box), and overall data distribution are depicted (n = 5,455).](/cms/asset/b2ab57ab-04ac-4fa1-a49b-5ea5e9e1e5e2/tbsm_a_2355272_f0007_b.gif)