
Figures & data
Figure 1. Study area: The Sundarbans Reserve Forest (SRF) and study area extent (SRF plus a 10 km buffer zone).
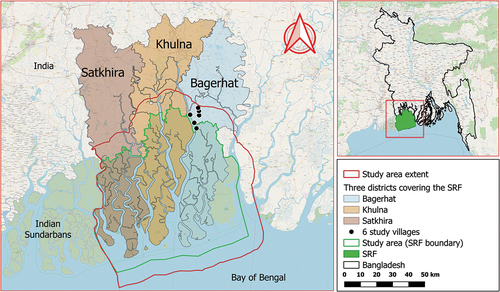
Table 1. Kruskal-Wallis tests of differences in the number of mapped landscape values between sociodemographic categories of respondents.
Table 2. Perceived sense of place in the Sundarbans mangrove forest.
Figure 2. Spatial distribution of material and non-material landscape values. Intensity decreases from red to yellow to green. The Sundarbans Reserve Forest (SRF), and the study area extent means the Sundarbans mangrove forest core zone including 10 km buffer zone.
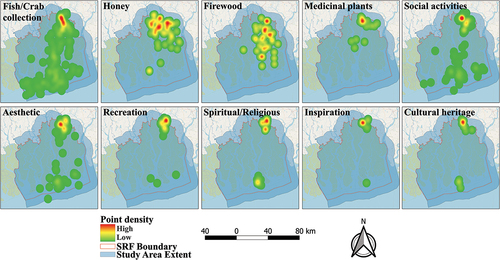
Table 3. Perceived threats to livelihood and sense of place.
Supplemental material