Figures & data
Table 1. Parameters of the AD, UASB, and IC reactors [Citation24, Citation25].
Figure 1. Energy flow diagram.
Figure 2. Average monthly water temperature and air temperature in Fuyang City, Anhui Province, in 2014.
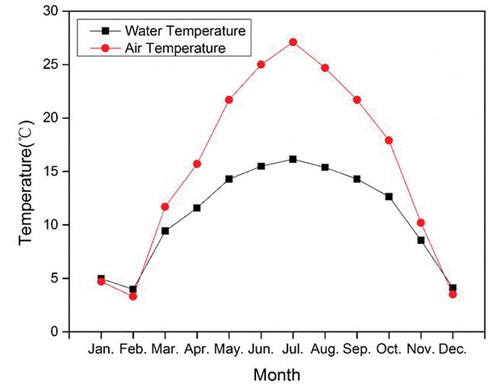
Figure 3. Monthly heat loss for the AD, UASB, and IC reactors.
Table 2. Biogas produced and heat supplied by the biogas for the three anaerobic reactors at different COD concentrations.
Figure 4. Net energy production of the AD.
Figure 5. Net energy production of the UASB reactor.
Figure 6. Net energy production of the IC reactor.
Figure 7. COD concentration versus annual net energy production for the three reactors.
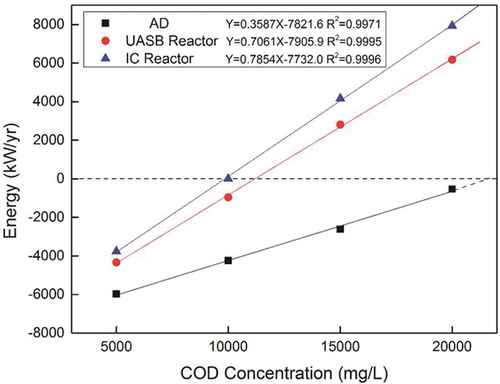
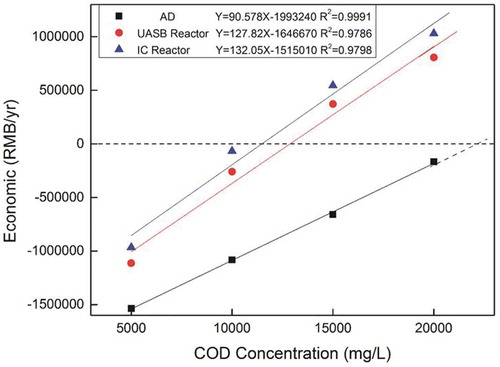
Figure 8. COD concentration versus annual net economic value for the three anaerobic reactors.