Figures & data
Figure 1. Research area showing the experimental plots and soil sampling locations.
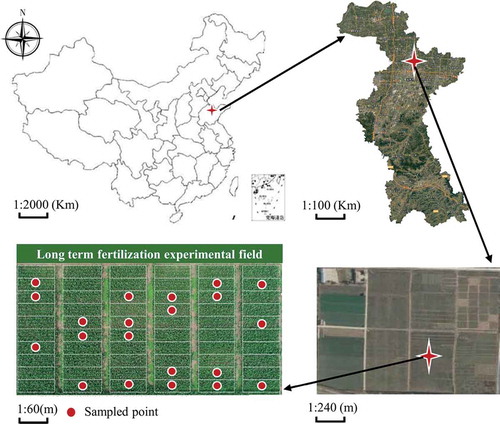
Table 1. Total nitrogen content (g/kg) in soil samples.
Table 2. T-test of total nitrogen content of the validation set and the modeling set.
Figure 2. Difference original reflectance of soil samples in wheat (a) and corn (b) seasons.
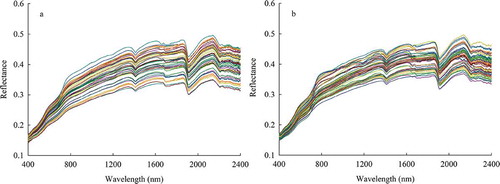
Figure 3. Correlation degree between soil reflectance and soil total nitrogen content after pretreatment of soil reflectance in wheat (a) and corn (b) seasons.
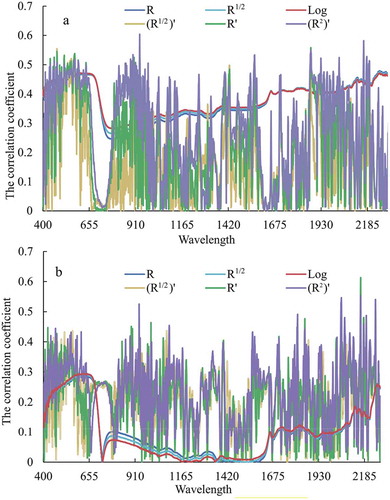
Figure 4. Comparison of correlation coefficients between wheat season (a) and corn (b) season soil reflectance before and after SASI calculation.
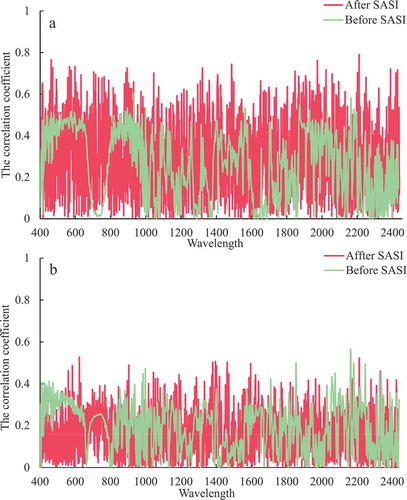
Figure 5. Measured vs. Predicted values of MLR, BPNN, PLSR modeling data (a), validation data (b) of wheat seasons.
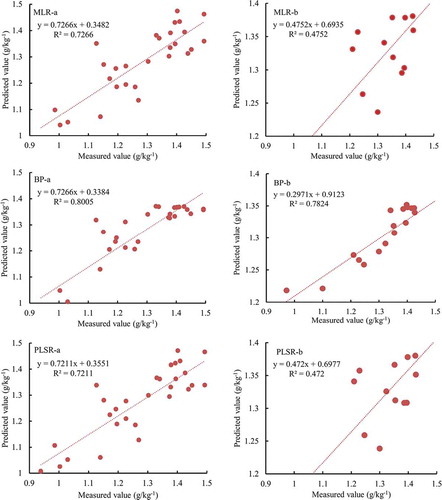
Figure 6. Measured vs. Predicted values of MLR, BPNN, PLSR modeling data (a), validation data (b) of corn seasons.
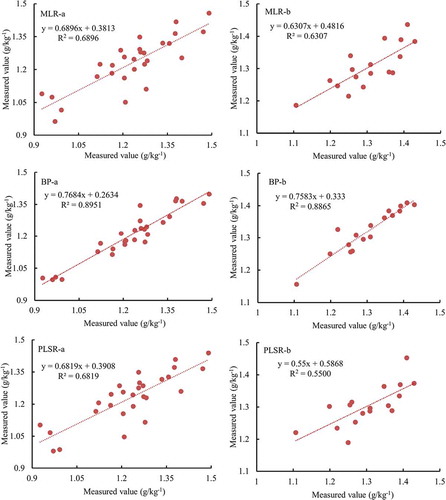
Table 3. Model analysis accuracy of different modeling methods for wheat-corn double cropping system.
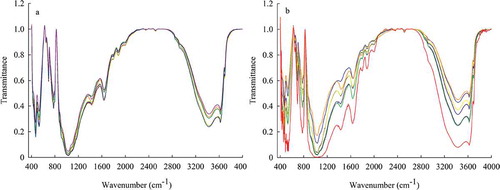
Figure 7. Infrared spectrum of corn (a) and wheat (b) seasons soil.