Figures & data
Table 1. Operating conditions of the SBR
Table 2. Specific phosphorus uptake rates in batch test
Figure 1. Pollutant removal performance in the system during enhanced nutrient reduction stage (Stage 2)
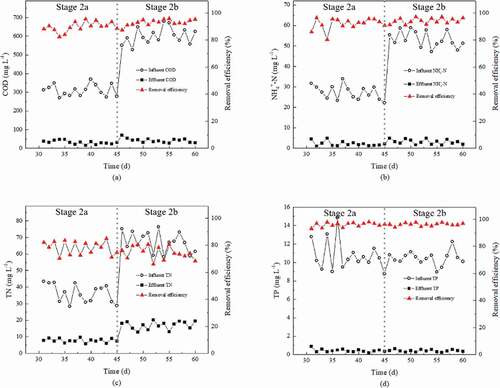
Figure 2. Removal of aniline and COD from aniline-containing influent with A/O/A mode
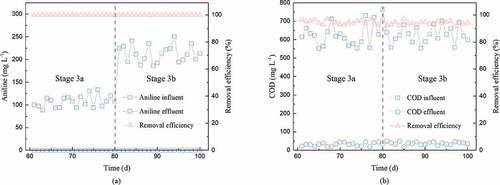
Figure 3. Nitrogen and phosphorus removal from aniline-containing wastewater with A/O/A mode (Stage 3)
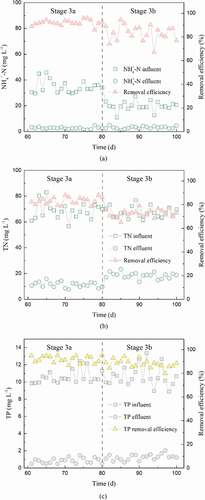
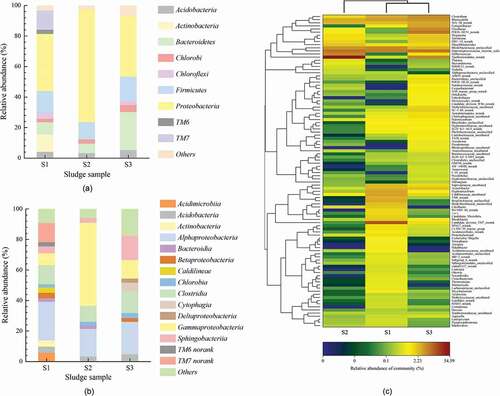
Figure 4. Relative abundances of bacterial groups in the three sludge samples at phylum level (a) and class level (b), and main functional genera in the SBR at different stages (c)