Figures & data
Figure 1. Typical SEM images of Ce-CNM at (a) low and (b) high amplification; (c) SEM image is PAN nanofiber; (d) EDS analysis image of the Ce-CNM
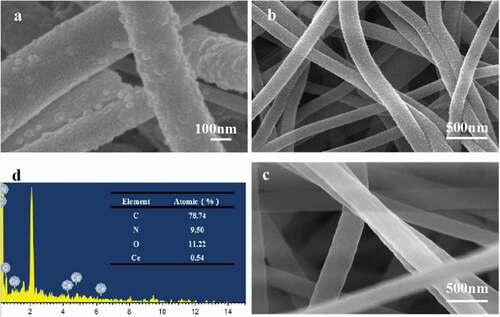
Figure 2. XRD patterns of Ce-CNM
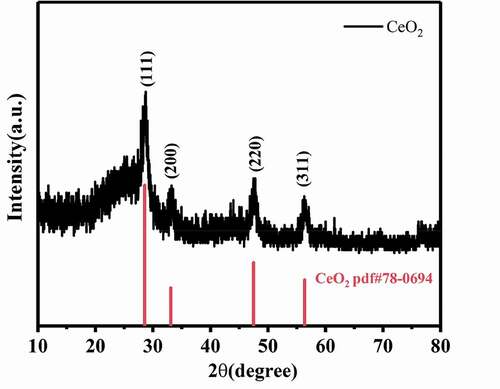
Figure 3. FTIR of (a) Ce-CNM, (b) Ce-CNM after adsorption of AsIII and (c) Ce-CNM after adsorption of AsV
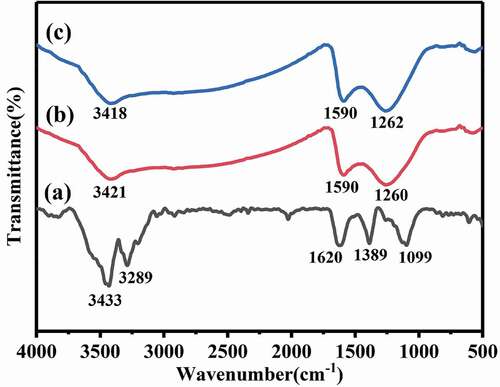
Figure 4. The pH dependent adsorption of arsenic by Ce-CNM
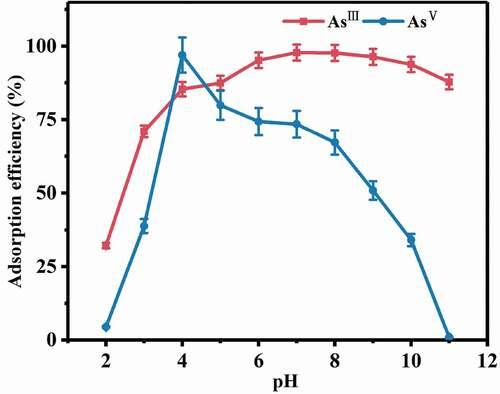
Figure 5. The adsorption efficiencies of arsenic at various temperatures
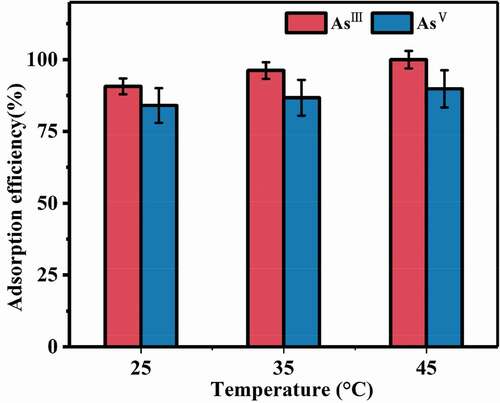
Figure 6. (a) The adsorption efficiencies of arsenic at various initial concentrations. (b) Selective kinetic adsorption of AsIII at different initial concentrations by Ce-CNM (pH = 12)
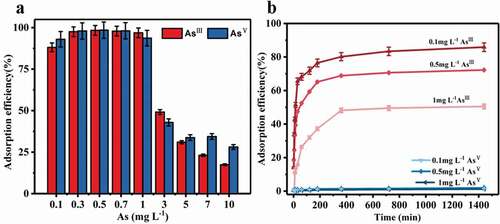
Figure 7. The influence of solution volume on adsorption efficiency
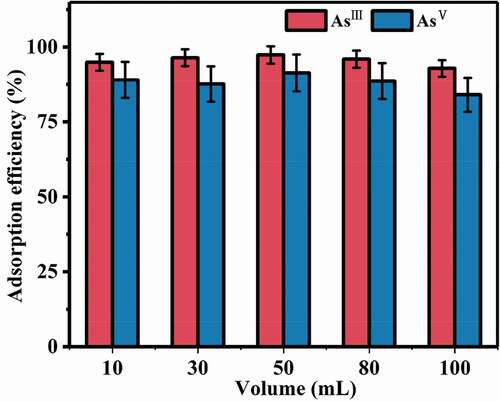
Figure 8. The influence of co-existing ion on the adsorption efficiency
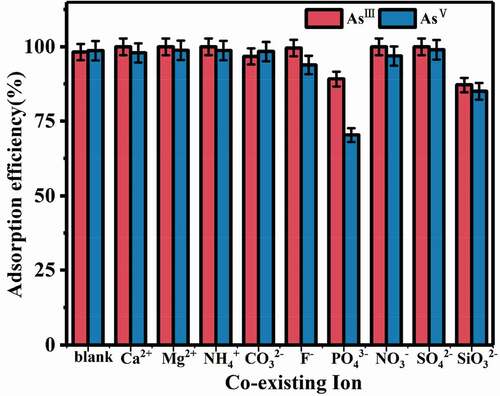
Figure 9. (a) Adsorption kinetics of different arsenic species; (b) Pseudo second order dynamical linear fit of AsIII and AsV
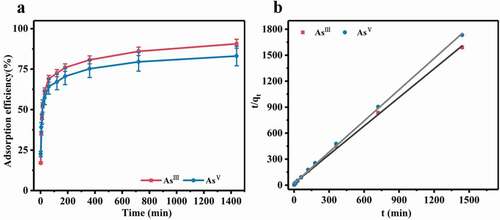
Table 1. Correlation kinetic fitting parameters of arsenic by Ce-CNM
Table 2. Adsorption isotherms fitting parameters of arsenic on Ce-CNM
Figure 10. Langmuir adsorption isotherms of Ce-CNM for (a) AsIII and (b) AsV
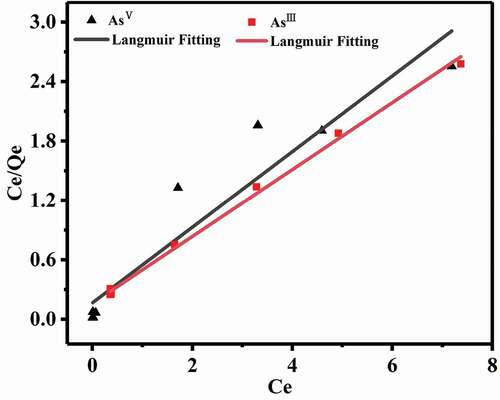
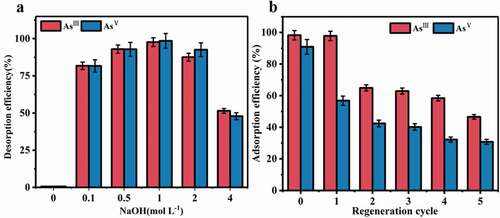
Figure 11. (a) The influence of NaOH concentrations on desorption efficiency of As; (b) Adsorption efficiency of Ce-CNM in five regeneration cycles