
Figures & data
Figure 1. (a) The map of China, with the red star showing the location of the Xuzhou area. (b) Sample locations in the Xuzhou area. (c) An example of the distribution of samples with the background of a satellite image
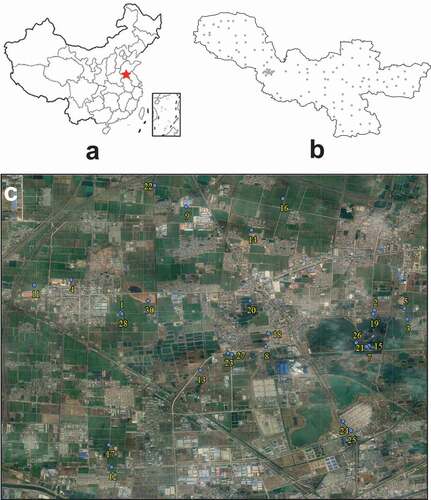
Table 1. Summary of statistical parameters of topsoil heavy metals (unit: mg/kg)
Table 2. Pearson correlation coefficients of topsoil heavy metals
Table 3. Semivariogram parameters and models of topsoil heavy metals
Figure 2. Semivariograms of topsoil heavy metals
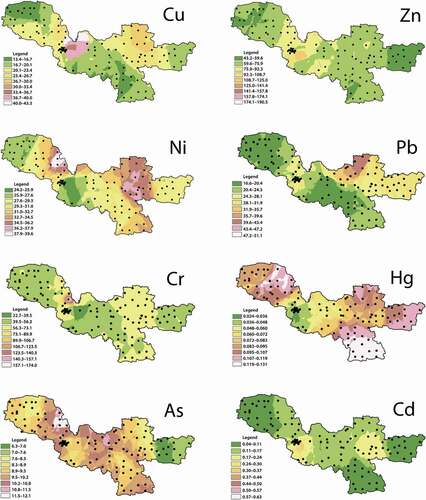
Figure 3. The spatial distribution maps of the eight heavy metal contents. unit: mg/kg
Supplemental material