Figures & data
Figure 1. The time-dependent changes of the algal densities with or without HA as affected by 0.5 mg/L of Cu (a) and variations of final growth rates (b) and Chl-a (c) of C. vulgaris under various Cu and HA concentrations. * and ** mean significantly (p < 0.05) and extremely significantly (p < 0.01), respectively
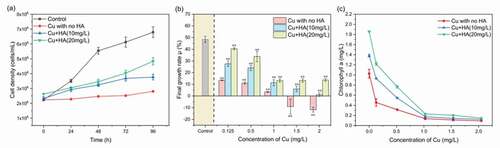
Figure 2. The concentrations of superoxide dismutase (a) and malondialdehyde (b) in C. vulgaris after 96 h of exposure as affected by different Cu and HA concentrations. * and ** mean significantly (p < 0.05) and extremely significantly (p < 0.01), respectively
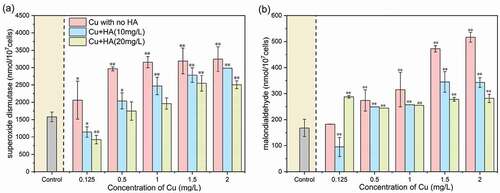
Figure 3. The Cu concentration-dependent changes of proteins and polysaccharides in the EPS matrix in the absence and presence of HA after 96 h of exposure. (a) proteins in the LB-EPS fraction; (b) proteins in the TB-EPS fraction; (c) polysaccharides in LB-EPS fraction; and (d) polysaccharides in TB-EPS fraction. * and ** mean significantly (p < 0.05) and extremely significantly (p < 0.01), respectively
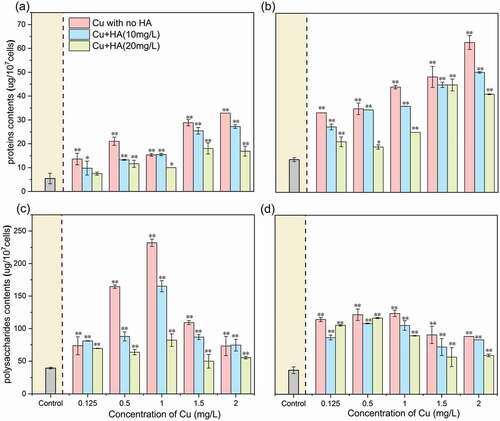
Figure 4. The EEM contours of tryptophan-like component (C1) (a) and tyrosine-like component (C2) (b) and their variations in fluorescent scores in response to different Cu and HA concentrations
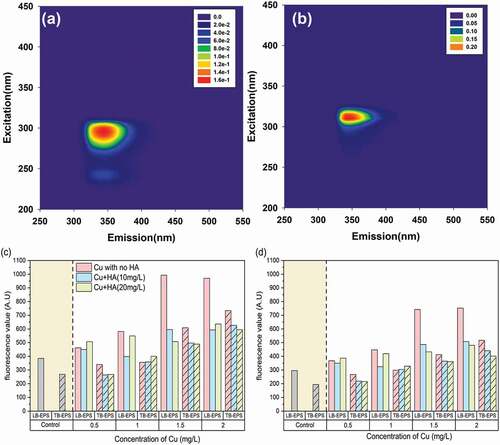
Figure 5. Variations in protein-like FIFFF fractograms and molecular weight distribution in response to Cu and HA. It was noted that (a) and (b) were the FIFFF fractograms for LB-EPS and TB-EPS fractions and (c) and (d) were the molecular weight distribution of protein-like substances for LB-EPS and TB-EPS fractions, respectively
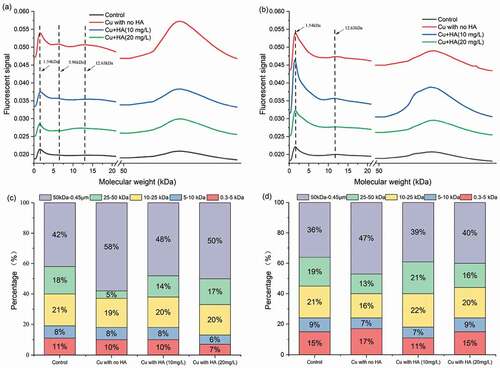
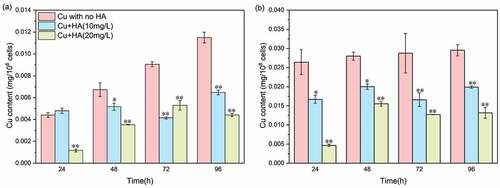
Figure 6. The time-dependent changes of Cu concentrations in LB-EPS (a) and TB-EPS (b) fractions in the absence or presence of HA. It is noted that 0.5 mg/L of Cu is applied herein. * and ** mean significantly (p < 0.05) and extremely significantly (p < 0.01), respectively