
Figures & data
Figure 1. Relative contribution of foods to the total dietary BTEX intake
Table 1. Instrument settings for the HP 5890 Series II GC and Headspace optimised for BTEX analysis
Table 2. Recovery analysis for BTEX determination in biota
Table 3. Summary of assumptions for THQ calculation in this study
Table 4. The BTEX concentration (mg/kg) of biota samples
Table 5. THQ and EDIb of BTEX from consumption of contaminated foods in Ubeji Creek
Table 6. Estimated daily usual food intakes for Ubeji Creek population
Table 7. Deterministic analysis results of dietary BTEX intake (mg/kg bw/day)
Table 8. Deterministic analysis results of dietary benzene intake (mg/kg bw/day)
Figure 2. Probabilistic distribution graph (A) and P-P plot (B) of all foods combined
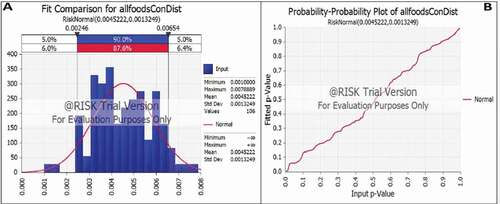
Figure 3. Probabilistic distribution graph (A) and P-P plot (B) of benzene distribution in all analysed foods
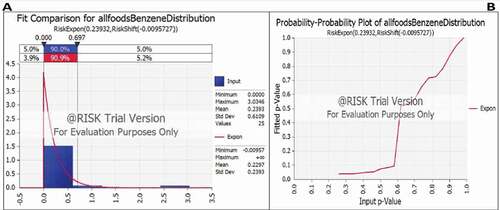
Figure 4. Probabilistic distribution graph (A) and P-P plot (B) of BTEX distribution in all analysed food
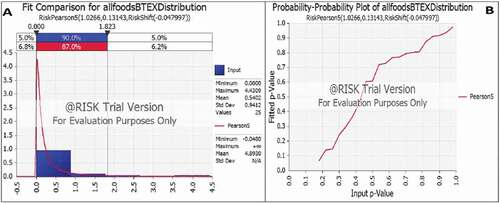
Table 9. Probabilistic analysis results of food consumption (kg/kg bw/day)
Table 10. Probabilistic analysis results of dietary benzene intake (mg/kg bw/day)
Table 11. Probabilistic analysis results of dietary BTEX intake (mg/kg bw/day)