Figures & data
Figure 1. The flowchart of this study.
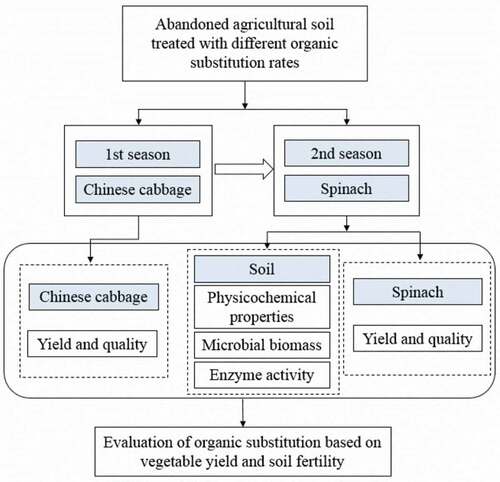
Table 1. Fertilizer application rates for different treatments (kg hm−2)
Figure 2. Chinese cabbage and spinach yields (fresh weight) under different organic substitution rates. Error bars mean standard deviations (n = 3). Different letters above the bars indicate significant differences (p < 0.05) in Chinese cabbage or spinach yields among treatments.
Table 2. Effect of organic substitution rates on quality of Chinese cabbage and spinach
Table 3. Soil physicochemical properties under different fertilizer treatments
Figure 3. Effects of different OSRs on microbial biomass C (SMBC), N (SMBN), P (SMBP), and SMBC/SOC (QMB). Error bars mean standard deviations (n = 3). Different letters above the bars indicate significant differences (P < 0.05) in SMBC, SMBN, SMBP, and QMB among treatments.
Figure 4. Effects of different OSRs on soil enzyme activities. Error bars mean standard deviations (n = 3). Different letters above the bars indicate significant differences (pP < 0.05) in catalase, sucrase, urease, and neutral phosphatase activities among treatments.
Figure 5. Principal component analysis (PCA) of soil microbial and physicochemical properties under different OSRs. (a) Load values of individual microbial and physicochemical properties. (b) Score chart of different fertilization treatments. The PC1 score of high OSRs (M50, M75 and M100) was significantly higher than that of low OSR and CF treatment (M25 and CF), and the PC2 score of fertilization treatments was significantly higher than that of CK (P < 0.05). The error bars represent the average ± SD (n = 3).