
Figures & data
Figure 1. Schematic diagram of the experimental set-up. 1- Air cylinder 2- Mass flow meter 3- Ice-water mixture bath 4- Gas mixer 5- Oscilloscope 6- Plasma reactor (discharge zone) 7- Catalyst 8- Gas chromatography 9- Ozone analyzer.
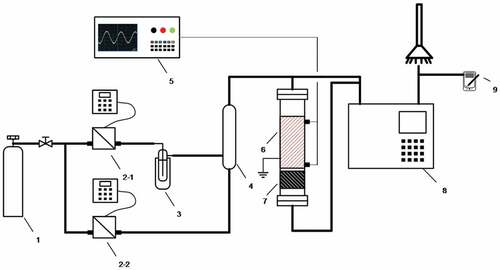
Figure 2. a). Effect of discharge length on toluene conversion; b). Effect of discharge length on CO2 selectivity; c). Effect of discharge length on ozone generation.
Figure 3. a). Effect of discharge voltage on toluene conversion; b). Effect of discharge voltage on CO2 selectivity; c). Effect of discharge voltage on ozone generation.
Figure 4. a). Effect of frequency on toluene conversion; b). Effect of frequency on CO2 selectivity; c). Effect of frequency on ozone generation.
Figure 5. Effect of feed concentration on the performance of toluene degradation.
Figure 6. Effect of gas flow rate on the performance of toluene degradation.
Figure 7. Effect of water vapor content on CO2 selectivity.
Figure 8. Performances of toluene removal in the plasma alone and plasma-catalysis system (Reaction conditions: Room temperature; Atmosphere pressure; [C7H8 concentration] = 70 ppm, [C7H8 flow rate] = 1 L/min, GHSV = 18,000 h−1).
![Figure 8. Performances of toluene removal in the plasma alone and plasma-catalysis system (Reaction conditions: Room temperature; Atmosphere pressure; [C7H8 concentration] = 70 ppm, [C7H8 flow rate] = 1 L/min, GHSV = 18,000 h−1).](/cms/asset/70a89c37-6813-4168-a81b-f138187131b5/tcsb_a_2065363_f0008_oc.jpg)
Figure 9. Outlet ozone concentration as a function of time in the plasma alone and plasma-catalysis system (Reaction conditions: Room temperature; Atmosphere pressure and [C7H8 concentration] = 70 ppm, [C7H8 flow rate] = 1 L/min and GHSV = 18,000 h−1).
![Figure 9. Outlet ozone concentration as a function of time in the plasma alone and plasma-catalysis system (Reaction conditions: Room temperature; Atmosphere pressure and [C7H8 concentration] = 70 ppm, [C7H8 flow rate] = 1 L/min and GHSV = 18,000 h−1).](/cms/asset/62923364-de73-4ea6-8b2b-9de149b8036f/tcsb_a_2065363_f0009_oc.jpg)