Figures & data
Table 1. Coded value based on the factor at a time experiment for 4 variables employed in the study.
Figure 1. Mechanism of microalgae flocculation process.
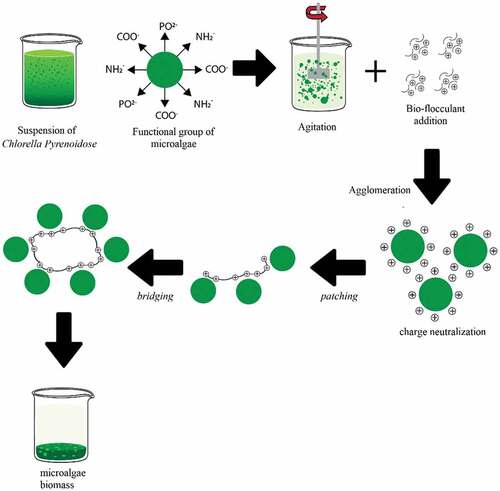
Figure 2. Effect of pH on bioflocculation.
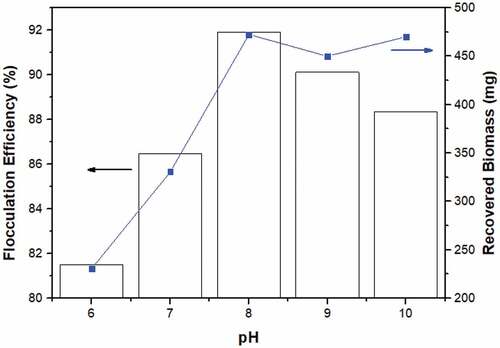
Figure 3. Effect of bioflocculant on bioflocculation.
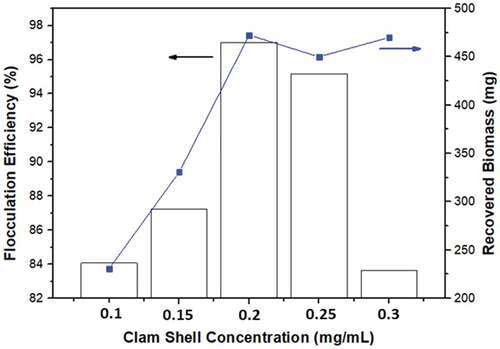
Figure 4. Effect of cationic inducer on bioflocculation.
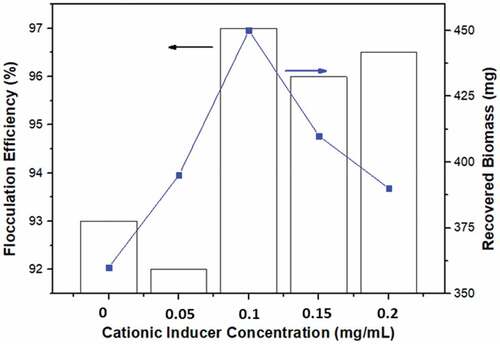
Figure 5. Effect of mixing rate on bioflocculation.
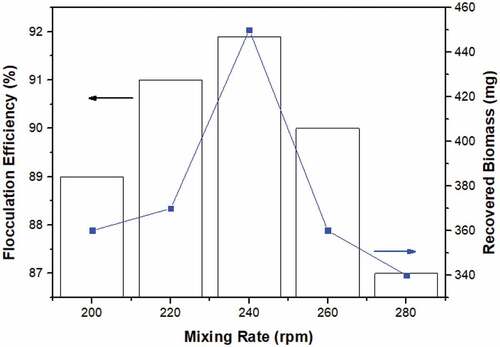
Table 2. Central composite design with observed responses pertaining to flocculation efficiency and recoverable biomass.
Table 3. ANOVA table for response surface function on flocculation efficiency.
Table 4. ANOVA table for response surface function on biomass.
Figure 6. 3D response surface and contour plots illustrating the interaction effects of a) Perna viridis-pH, b) cationic inducer-pH, c) mixing rate-pH, d) cationic inducer-Perna viridis, e) mixing rate- Perna viridis, and f) mixing rate-cationic inducer on the flocculation efficiency of Chlorella sp. Flocculation.
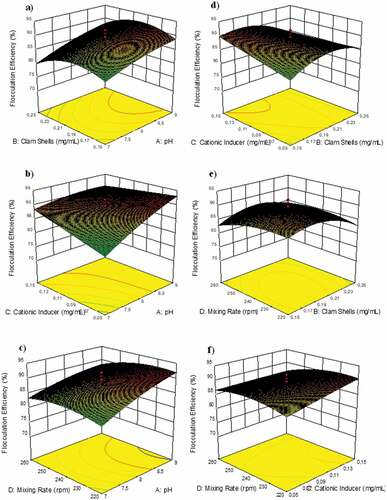
Figure 7. 3D response surface and contour plots illustrating the interaction effects of a) Perna viridis-pH, b) cationic inducer-pH, c) mixing rate-pH, d) cationic inducer-Perna viridis, e) mixing rate- Perna viridis, and f) mixing rate-cationic inducer on the biomass of Chlorella sp. flocculation.
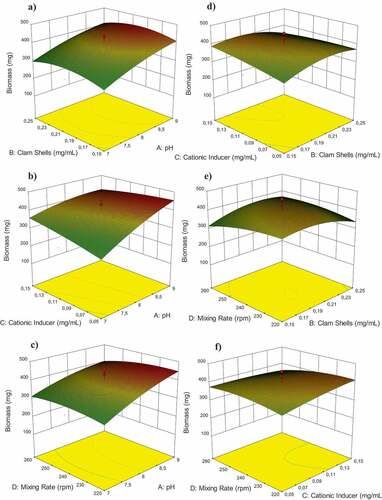
Figure 8. SEM images of microalgae (a) before and (b) after flocculation.
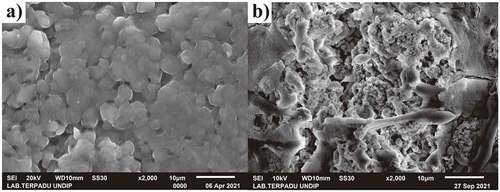
Table 5. Energy Dispersive X-ray spectroscopy (EDX) analysis results for the chemical constituents of Chlorella sp flocculation.
Figure 9. X-ray Diffraction (XRD) curves of microalgae control (black line) and after flocculation (red line).
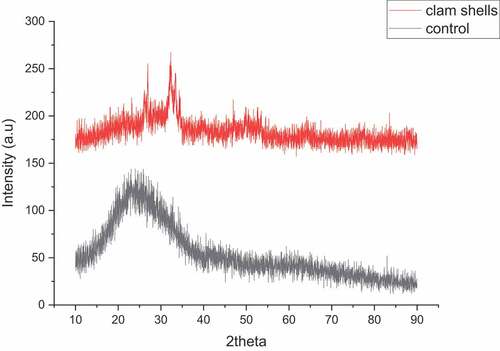
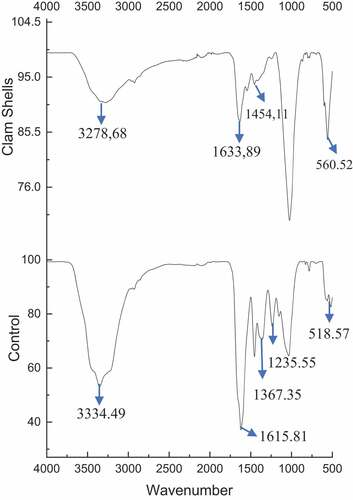
Figure 10. FTIR spectra of microalgae control and after flocculation process.