Figures & data
Figure 1. Total monthly rainfall/precipitation (mm), mean monthly maximum and minimum temperatures (oC) during study period (2017 to 2019). The data was obtained from https://www.worldweatheronline.com/.
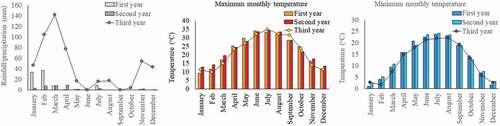
Table 1. Properties of biochar and manure used as soil amendments.
Table 2. Application rates of biochar co-amended with NPK fertilizer and poultry manure on field plots cultivated with Cuminum cyminum and Foeniculum officinales. Treatments were applied to the same plot once a year for three years in the field experiment. Amendment rates are on dry weight basis.
Figure 2. Mean (± SD) of yield and stover biomass of F. vulgare and C. cyminum over three years. Bars with different letters indicate within year significant difference at P ≤ 0.05. Control; no fertilizer amendment, S/G; small ruminant manure, WB; wood-derived biochar, MB; farmyard manure-derived biochar, 1.6, 3.3 and 6.6 are amendment rates of fertilizers at 1.66, 3.34 and 6.64 t ha−1 rates respectively.
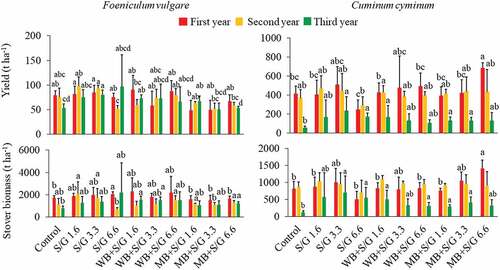
Table 3. Total N (mg g−1), total P (mg g−1), nitrogen use efficiency (NUE) and phosphorus use efficiency (PUE) of stover and seeds of F. vulgare, total P (mg g−1) and PUE of stover and seeds of C. cyminum of third year crops.
Figure 3. Mean (±SD) of total inorganic N and soluble inorganic P of soil samples. Bars with different letters indicate significant differences between treatments for a given crop (F. vulgare or C. cyminum) at P ≤ 0.05. Bars with * indicate difference between crops (F. vulgare versus C. cyminum) at P ≤ 0.05. Control; no fertilizer amendment, S/G; small ruminant manure, WB; wood-derived biochar, MB; farmyard manure-derived biochar, 1.6, 3.3 and 6.6 are amendment rates of fertilizers at 1.66, 3.34 and 6.64 t ha−1 rates respectively.
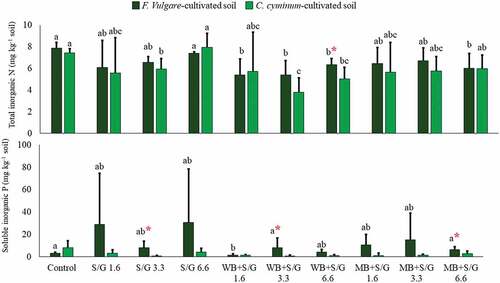
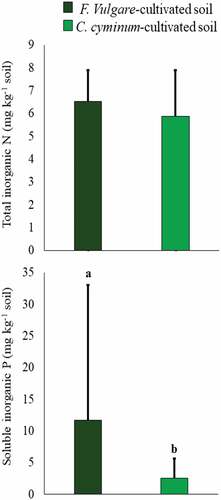
Figure 4. Mean (±SD) of total inorganic N and soluble inorganic P of soil samples under F. vulgare and C. cyminum cultivation. Bars with different letters indicate significant differences between soils cultivated with F. vulgare and C. cyminum.