
Figures & data
Table 1. The concentrations PFASs in surface water (ng/L) and sediment (ng/g) samples.
Figure 1. Concentrations of the PFASs detected in the river basin around the FIPs. (a) surface water; (b) sediment.
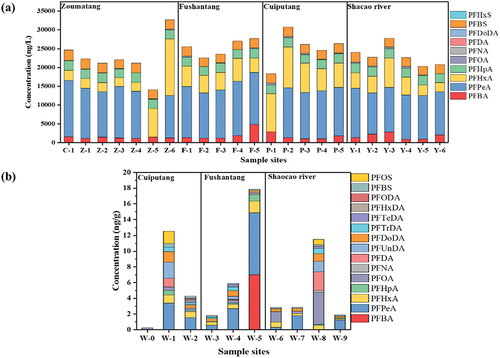
Figure 2. Three-dimensional principal component in surface water. (a) loading plot and (b) score plot.
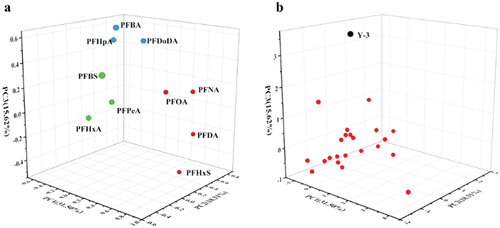
Figure 3. Three-dimensional principal components in sediment. (a) Loading plot and (b) Score plot.
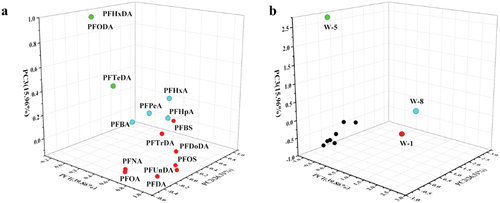
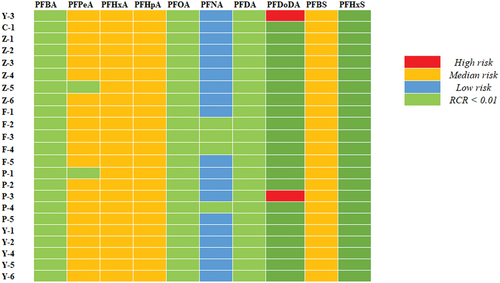
Figure 4. Risk characterisation ratio (RCR) of the 10 PFASs to aquatic organisms.
Supplemental material
Supplemental Material
Download MS Word (329.8 KB)Data availability statement
All data reported here can be made available on request.