Figures & data
Figure 1. Distribution map of the five fine-aroma cocoa genotypes collected for the Cd sensitivity test.
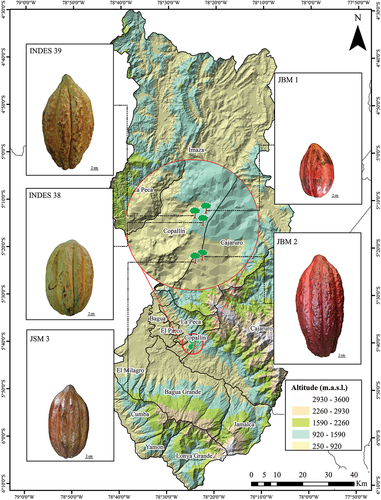
Figure 2. Scheme of assembly of the floating root hydroponic system for Cd sensitivity testing in young plants of five genotypes of fine-aroma cocoa.
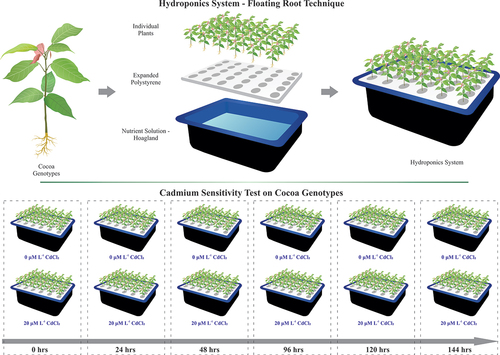
Figure 3. Sample collection scheme and analysis process for the quantification of Cd accumulation in young plants of five fine-aroma cocoa genotypes.
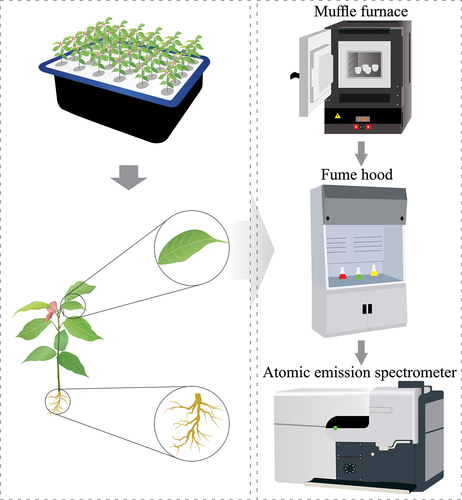
Figure 4. Evolution of Cd accumulation levels in leaves (a) and roots (b) of five fine aroma cocoa genotypes. P values less than 0.05 (*) and less than 0.001 (****), according to Tukey’s test at the 95% confidence level. Mean values and vertical line indicate ± standard deviation (SD).
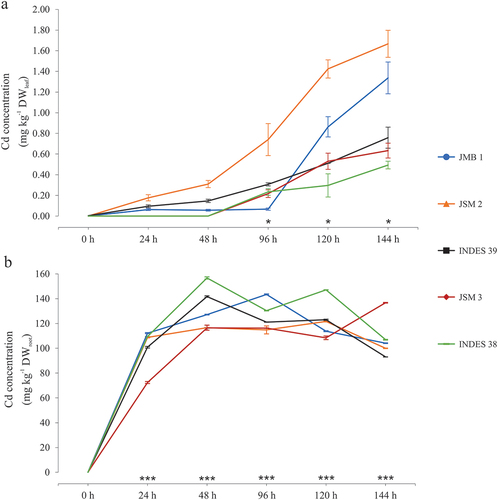
Figure 5. Polynomial regression curves for cadmium accumulation in leaves (a) and roots (b) of five genotypes of fine-aroma cocoa grown under exposure to CdCl2 for different times.
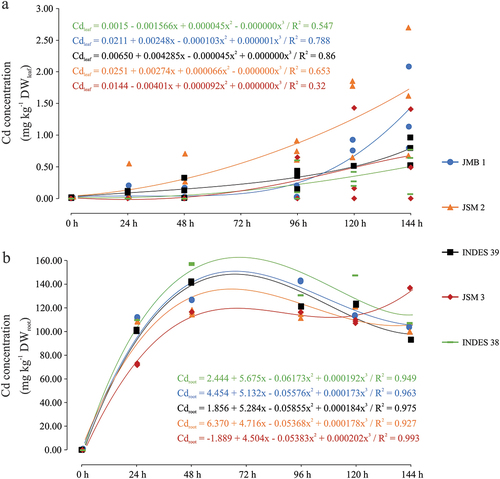
Figure 6. (a) Cd distribution in leaves (green color) and roots (brown color) of five fine aroma cacao genotypes. (b) polynomial regression fitting curves for the root-leaf Cd translocation factor in five cacao genotypes. TF: translocation factor; BF: bioconcentration factor.
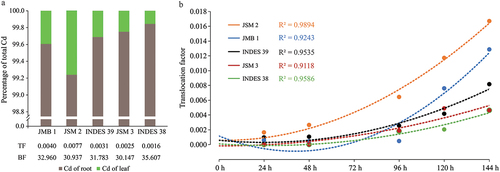
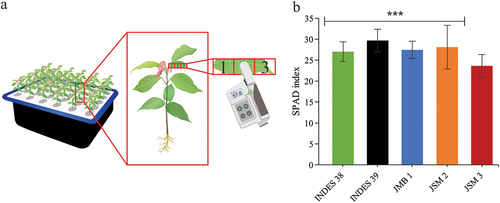
Figure 7. (a) schematic diagram for SPAD measurements and (b) relative chlorophyll content in five fine-flavored cocoa genotypes. P value less than 0.001 (****).