Figures & data
Figure 1. Compost (crosses) and air (triangles) sampling locations at the composting facility during visit 1 (red), 2 (blue) and 3 (orange). The black arrow denotes the chronological steps of the composting process. Aerial background image from Google earth.
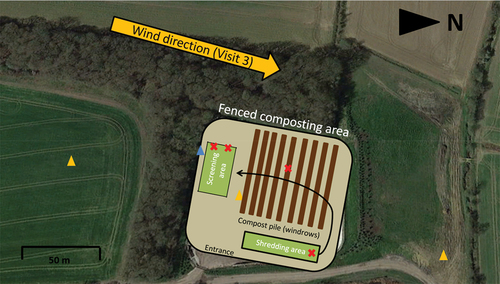
Figure 2. Microplastic (MP) abundance, size and composition (left to right) in compost (top) and air (bottom). (a) the average concentration of MPs in the 4 compost samples analysed (n 5 g−1 dry weight); (b) relative frequency (%) of MP size (µm) in compost; (c) the relative abundance of plastic polymers for the 40 confirmed MP in compost collected at each stage of the process (shredding, turning, screening 30 mm, and screening 10 mm); (d) the concentration of airborne MP (n m−3); (e) relative frequency (%) of MP size (µm) in air (total 1200 L sampled); (f) the relative abundance of plastic polymers for the 29 confirmed MP in air at locations upwind, on-site, and downwind of the industrial composting site. Box and whisker plot shows median, 25th and 75th percentiles and 5th to 95th percentile. PA = polyamide; PE = polyethylene; PET = polyethylene terephthalate; PP = polypropylene; PS = polystyrene; PU = polyurethane; PVA = polyvinyl alcohol; and PVC = polyvinylchloride.
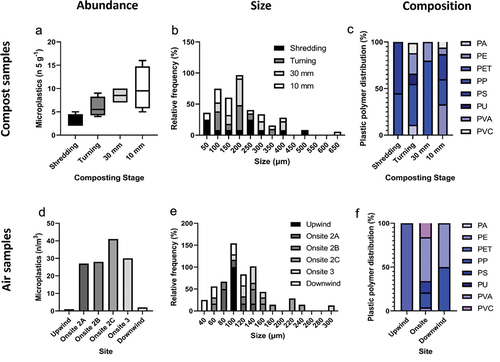
Table A1. Compost and air sampling details.
Table B1. Meteorological conditions on the three sampling days.
Figure D1. The morphological distribution of MPs found in compost at a) shredding, b) turning, c) screening a (30 mm), d) screening B (10 mm), and e in air on-site.
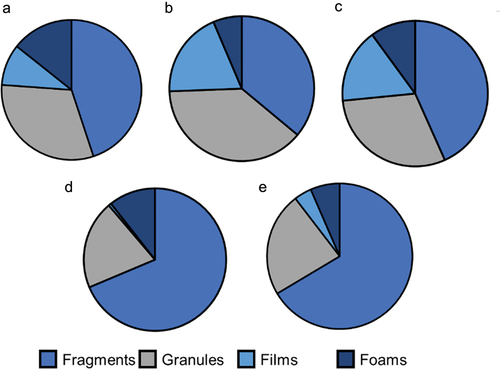
Figure E1. Example micrographs of some of the microplastics identified in compost and air samples and particles identified as polystyrene sulfonic acid. From left to right and top to bottom: downwind air sample, downwind air sample, on-site air sample, on-site air sample, upwind air sample, shredding stage compost sample, turning stage compost sample, turning stage compost sample, screening stage compost sample. Corresponding spectra are in Figure SF3. Scale bar = 100 µm.
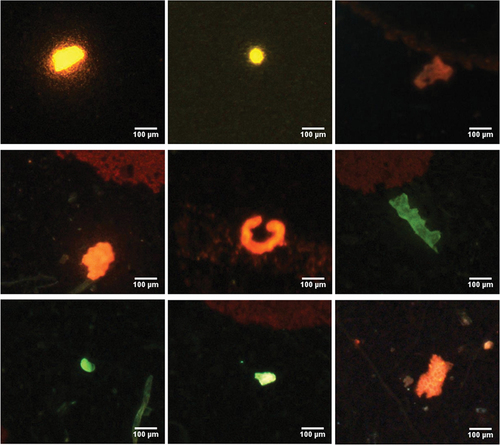
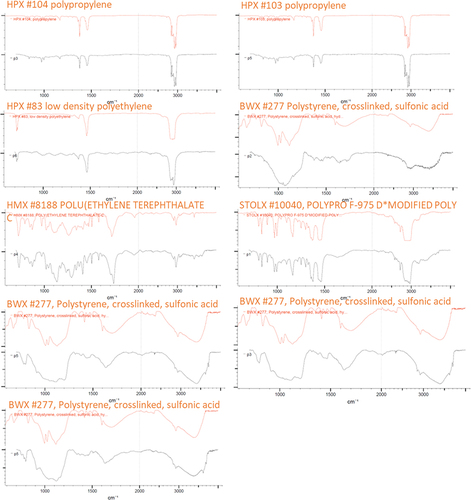
Figure F1. Example spectra of the MPs and polystyrene sulfonic acid particles identified in compost and air samples as presented in Figure SD1. From left to right and top to bottom: downwind air sample (polypropylene, HQI 98.14), downwind air sample (polypropylene, HQI 95.95), on-site air sample (low-density polyethylene, HQI 97.70), on-site air sample (polystyrene, HQI 92.27), upwind air sample (polyethylene terephthalate, HQI 90.92), shredding stage compost sample (polypropylene, HQI 95.88), turning stage compost sample (polystyrene, HQI 93.56), turning stage compost sample (polystyrene, HQI 93.35), screening stage compost sample (polystyrene, HQI 92.19). HQI = hit quality index. Scale bar = 100 µm.