Figures & data
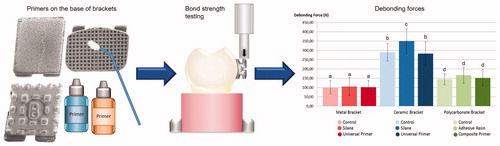
Table 1. Materials used in the study.
Table 2. Test groups, primers and the primer applying procedure.
Table 3. Adhesive remnant index (ARI), definition of scores.
Figure 1. Scanning electron microscope images of the bracket bases. (1, 2) metal bracket with a mesh base design, magnification X18 and X100; (3, 4) ceramic bracket with small spheres on the base, magnification X18 and X100; (4, 5) polycarbonate bracket with large protuberances on the base, magnification X18 and X100.
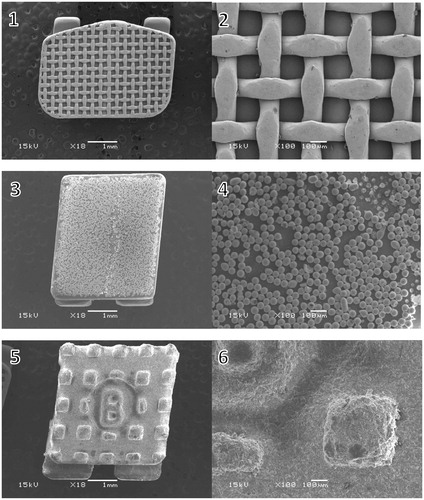
Figure 2. Surface contour analysis of the metal bracket, a close-up of the mesh on the bracket base. The overall difference between the highest and the lowest point of the base is approximately 125 µm.
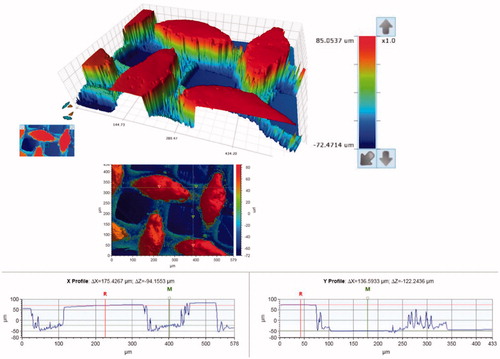
Figure 3. Surface contour analysis of the ceramic bracket, a close-up of the small spheres on the bracket base. The contour of the spheres accounts for the artifact around the edges of the spheres (the spikes). The overall difference between the highest and the lowest point of the base is approximately 50 µm.
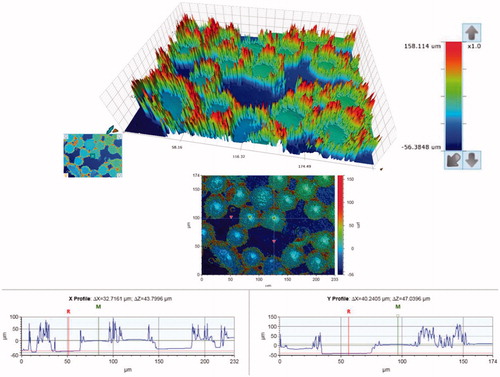
Figure 4. Surface contour analysis of the polycarbonate bracket, a close-up of one of the square protuberances on the bracket base. The overall difference between the highest and the lowest point of the base is approximately 150 µm.
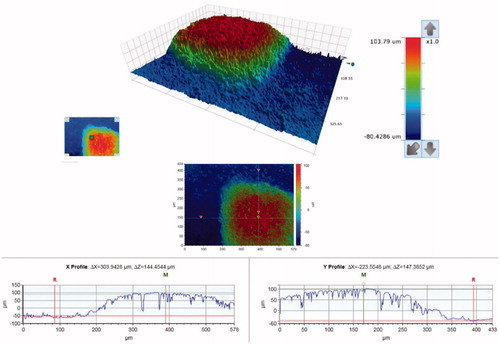
Figure 5. Bond Strength (MPa) of test groups, error bars represent standard deviation, the different letters above the columns represent statistically significant differences between groups (p < .05).
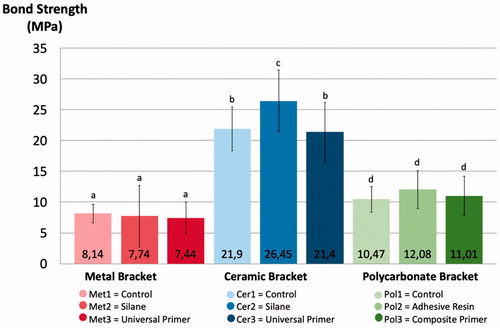
Figure 6. ARI scores of the test groups. See for ARI score description.
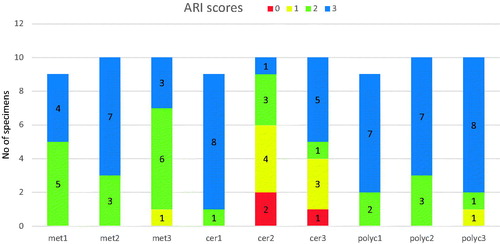
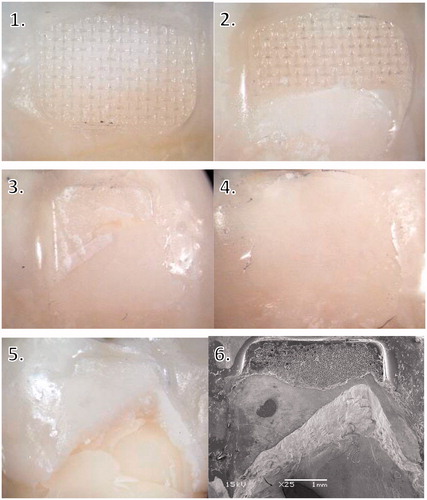
Figure 7. Examples of ARI scores. 1–5 light microscope images. 1 = ARI score 3, 2 = ARI score 2, 3 = ARI score 1, 4 = ARI score 0, 5 = ARI score 1 with enamel fracture, 6 = SEM image of the same sample as picture 5: adhesive remnants and fractured enamel, magnification X25.