Figures & data
Table 1. Overview of the restorative materials and respective manufacturers as well as the pretreatment of enamel and dentine for the materials investigated in this study.
Figure 1. Schematics of the cavity preparations for marginal assessments with margins in enamel (left) or dentine (right).
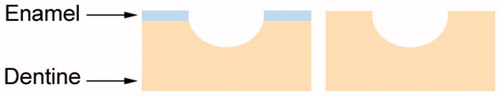
Figure 2. Box-plot for shear bond strength (MPa) of the restorative materials according to pretreatment of enamel after thermocycling and storage for 28 days. The boxes include median and 25–75% quartiles, the whiskers represent the interquartile range. Different letters represent statistical significance.
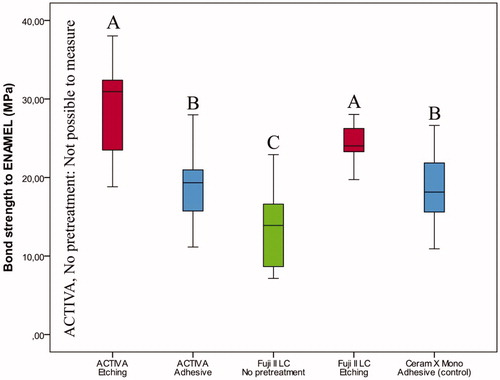
Figure 3. Box-plot for shear bond strength (MPa) of the restorative materials according to pretreatment of dentine after thermocycling and storage for 28 days. The boxes include median and 25–75% quartiles, the whiskers represent the interquartile range. Different letters represent statistical significance.
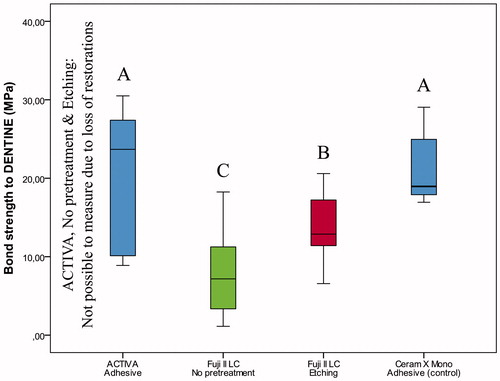
Figure 4. Box-plot for wall-to-wall contraction (%) of the restorative materials according to pretreatment of cavities with margins on enamel after thermocycling and storage for 28 days. The boxes include median and 25–75% quartiles, the whiskers represent the interquartile range. Different letters represent statistical significance.
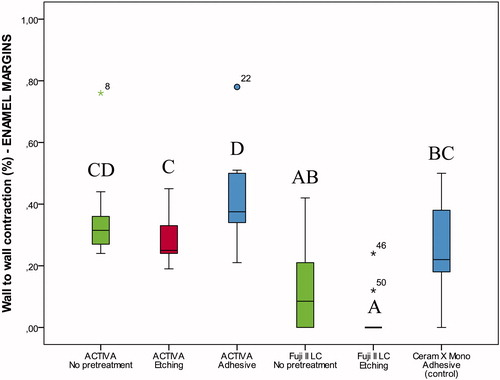
Figure 5. Box-plot for wall-to-wall contraction (%) of the restorative materials according to pretreatment of cavities with margins on dentine after thermocycling and storage for 28 days. The boxes include median and 25–75% quartiles, the whiskers represent the interquartile range. Different letters represent statistical significance.
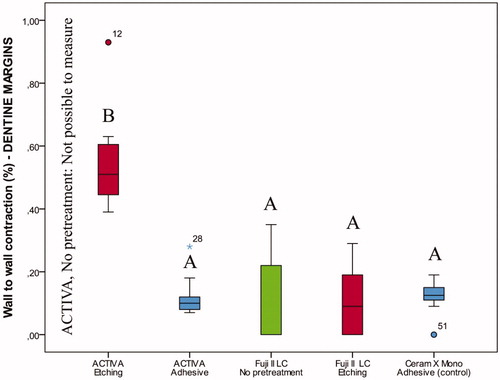
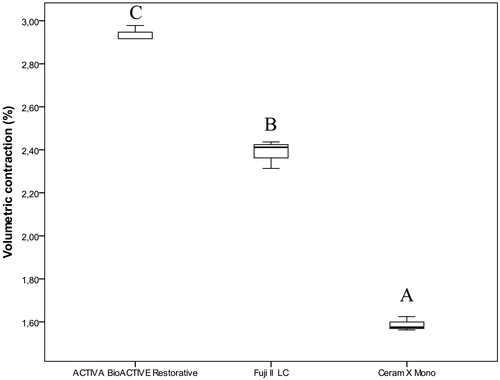
Figure 6. Box-plot for volumetric contraction (%) of the investigated restorative materials. The boxes include median and 25–75% quartiles, the whiskers represent the interquartile range. Different letters represent statistical significance.