Figures & data
Figure 1. Number of CFU normalized to the control after 60 min MDCT on fresh material (Short term) and on material after 18 weeks in water (Long term) (N = 4). CH and COS (20%) labeled with * indicates significant statistical difference compared to ZOE.
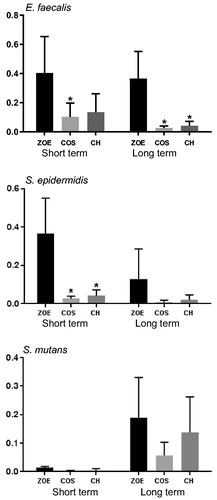
Figure 2. Live/dead staining of S. epidermidis after MDCT on unmodified ZOE (left) and ZOE with 20% CH (right). Green indicates live cells and red dead cells.
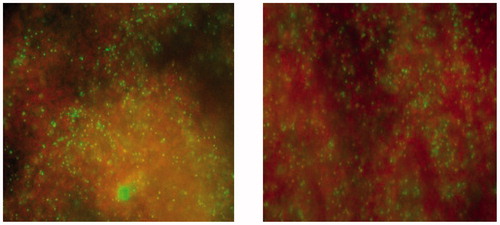
Figure 3. Amount of eugenol leaching from ZOE discs with and without CH or COS where the water was replaced every week and leaching during one week after 1, 4 and 18 weeks in water was analysed (N = 6).
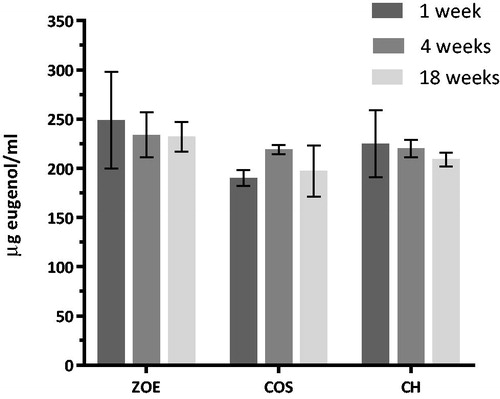
Figure 4. Growth curve of bacteria after 18 h measured at OD 600 nm in medium with eugenol (0–1250 μg/ml) (n = 6).
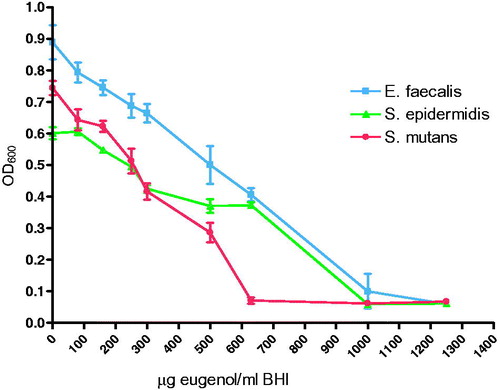
Table 1. Minimum inhibitory concentration, MIC, after 18 h growth in medium with eugenol (µg/ml).
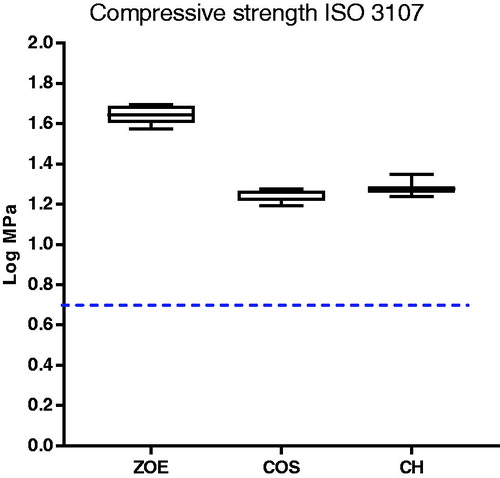
Figure 5. Compressive strength of ZOE specimens without and with 20% CH or COS as described in ISO 3107(values log transformed). The minimum requirement of 5 MPa is indicated by the horizontal dotted line (N = 5 for ZOE, N = 11 for COS and CH).