
Figures & data
Table 1. Investigated surface protective agents, manufacturer, material type and lot numbers.
Table 2. The composition of each material based on manufacturer’s infosheet.
Figure 1. The linear relation between the different concentrations of methylene blue standard solutions and their respective absorbance values.
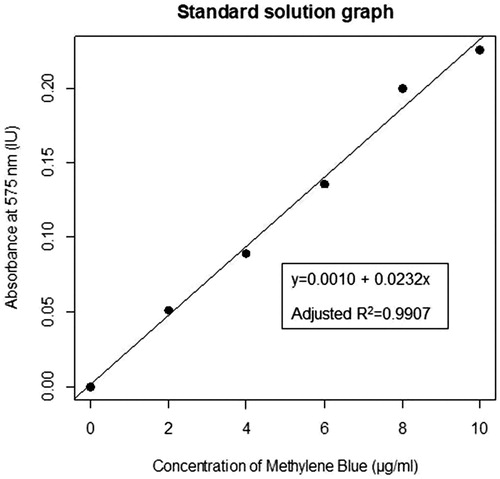
Figure 2. The concentrations of methylene blue in control versus treatment groups are displayed using the Box and Whisker plot overlaid with Beeswarm plot.
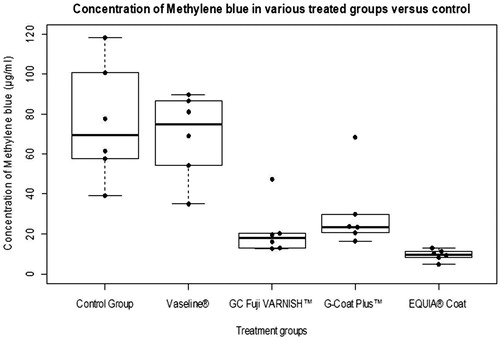
Table 3. The descriptive statistics of each experimental group.
Table 4. Summary of Tukey HSD test.
Supplemental material